A Trader's Guide to Fibonacci Trading Strategies
One of the first strategies you are most likely to come across as a trader is the Fibonacci trading strategy. This strategy has long been a favorite of traders for pinpointing hidden support and resistance levels in any market.
While trading the Fibonacci strategy is simple and straightforward, most traders don't just know how to use it the right way. So, we’ll try to demystify Fibonacci retracements and show you how to draw them correctly in this article. You’ll also discover 3 potent Fibonacci trading strategies that you can start using right away.
Lastly, we’ll also explore how you can autopilot your trading with the power of AI. Enough said, let’s get started.
What is the Fibonacci Trading Strategy?
The Fibonacci trading strategy is a method of using specific mathematical ratios to predict potential support and resistance levels in the market.
It's common knowledge that price action trading is mostly about pattern recognition. As such, it is only natural for traders to be drawn to the concept of using the Fibonacci sequence even in trading. After all, the pattern has been seen in different areas of life, from music to art, plants, and so on.
So, when traders use Fibonacci retracement levels on a price chart, they usually stick to the key Fibonacci levels such as the 23.6%, 38.2%, 50%, 61.8% (and sometimes 78.6%), and for some reason, they seem to work really well. So, as more and more traders adopt this strategy, you can expect these levels to reflect critical support and resistance zones in the market.
Now, let’s take a closer look at trading with Fibonacci. If you have spent some time observing a price chart, you'll notice that in a bullish trend, the price doesn’t continue to go up forever. At some point, price will “give back” some of that gain before continuing upward.
Fibonacci levels tell us roughly how far that pullback might go. That way, we know precisely where to wait for the price in order to join the next bullish run. The reverse is also true for a bearish market.
Sometimes, this level can be the 50% or 61.8% or others. However, most traders focus on the 61.8% level.
Why 61.8%? This is the golden ratio (approximately 0.618), which appears in art, nature, and yes, financial markets. In fact, 61.8% retracement is so influential that the area between 50% and 61.8% is nicknamed the “golden pocket” or golden zone. We’ll discuss a strategy around that soon.
Other levels have their roles too: 38.2% retracement is a shallow pullback in a strong trend (a “buy-the-dip” spot), and 23.6% is even shallower (often hit during very strong momentum moves). However, you may want to stay away from trading these Fibonacci ratios when you're just starting out.
It’s important to note that the Fibonacci strategy works best in trending markets. Now that we have an overview of what the Fibonacci trading strategy is about, let’s quickly learn how to draw it correctly.
How to Correctly Draw Fibonacci Retracements on a Trading Chart
If you’ll only learn just one thing from this article, it should be how to draw Fibonacci retracement levels correctly. This is where most traders fail; to draw Fibonacci retracement levels so they become valuable and accurate to your charts. Place them wrong, and you’ll end up with bad trades at prices that don’t make sense. Place them right, and you’ll have a powerful map of the market’s potential turning points.
Remember that one key reason Fibonacci retracement levels are such an effective tool is that many professional retail traders use the same levels. This often makes these levels more valuable and helps traders find key levels.
Here’s the only guide you’ll need to draw Fibonacci retracement the right way every time:
Identify the Market Trend
The first thing you want to do is to determine whether you’re dealing with an uptrend or a downtrend. If you’re not sure or the trend is not clear, just move to another asset.
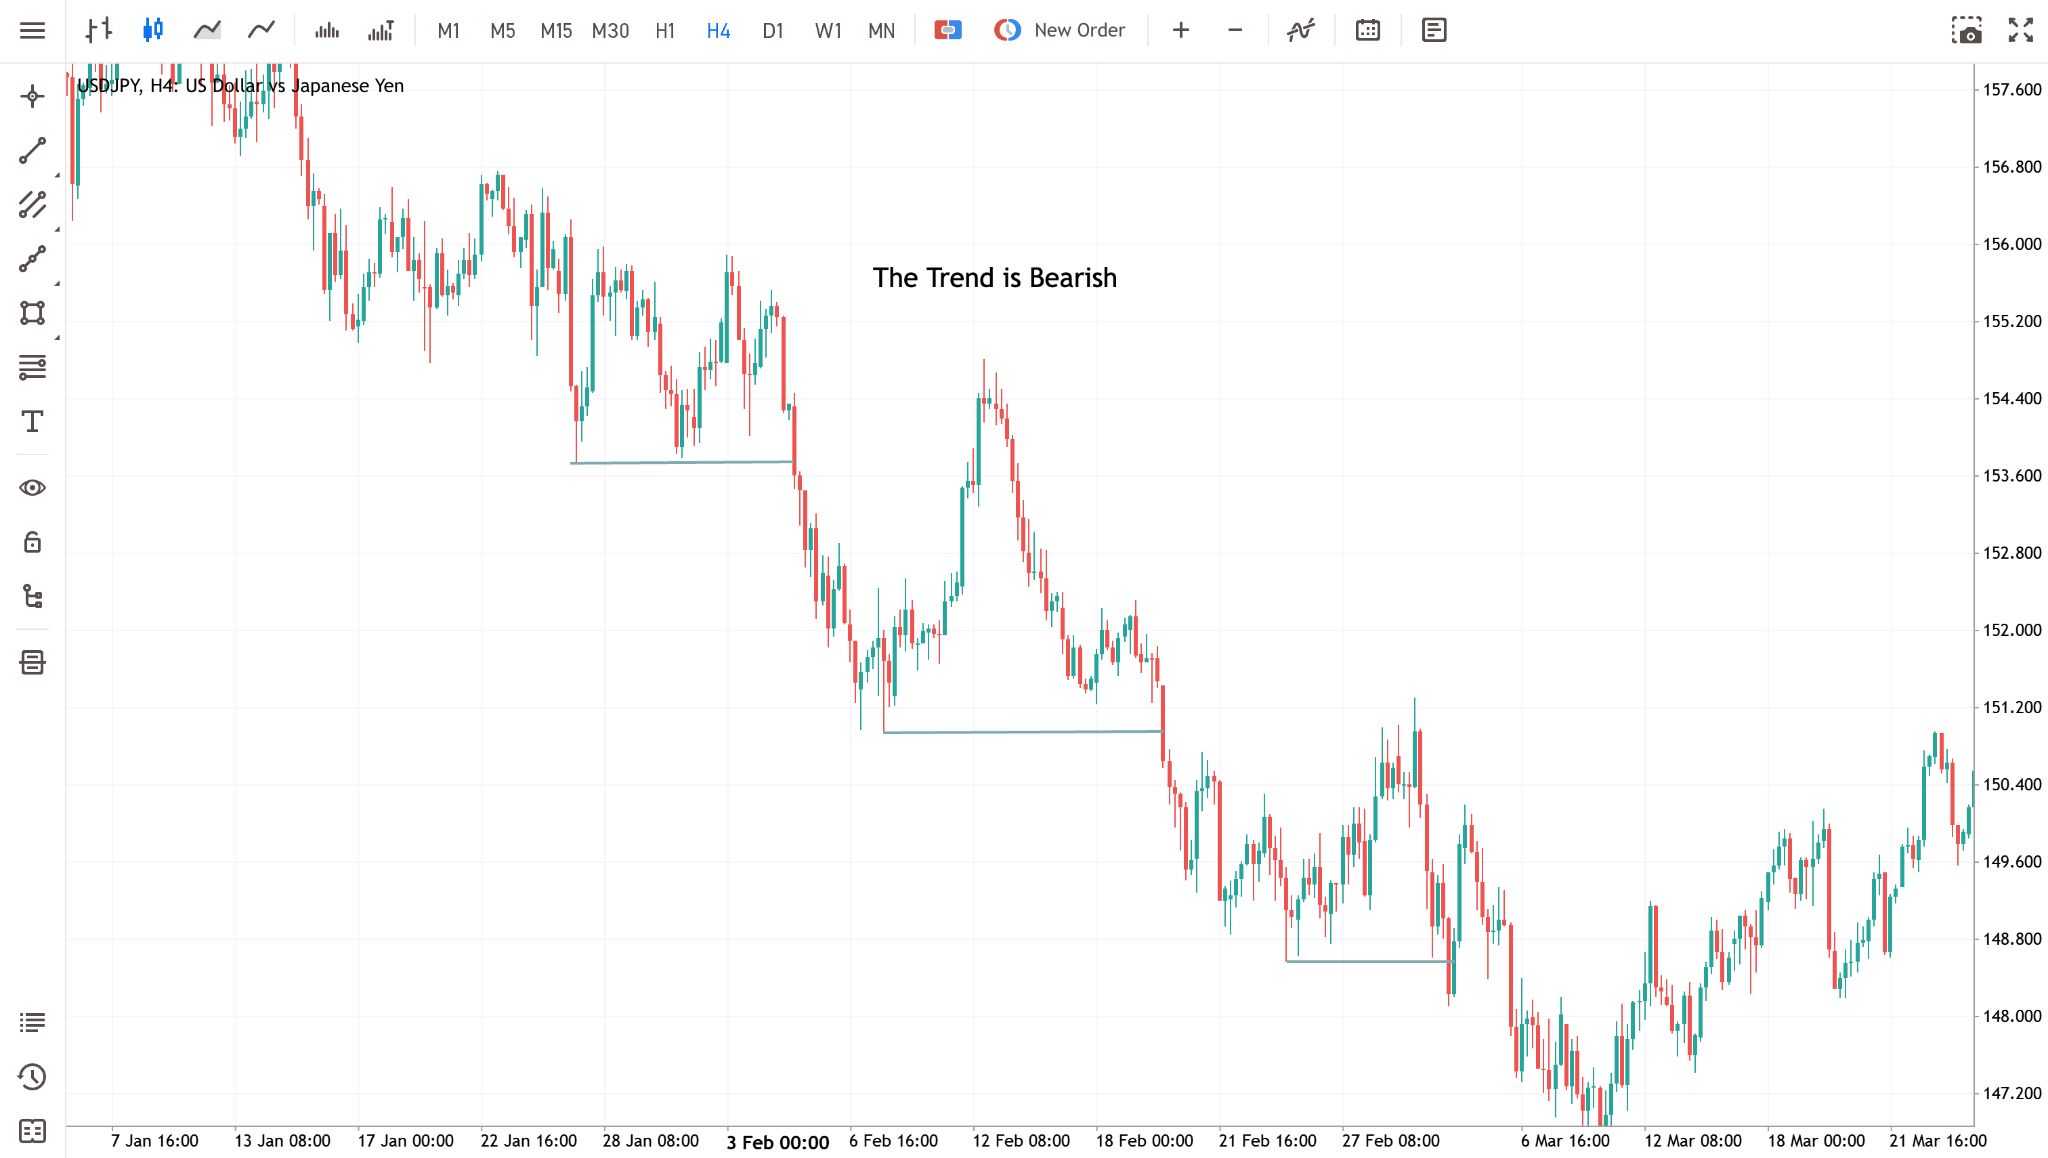
To recognize the trend, simply look back and observe what the price has been doing. If price has been creating a series of higher highs and higher lows, you’re in an uptrend. However, if price is creating a series of lower highs and lower lows (like the chart above), you’re in a downtrend.
Pick the Significant Swing High and Low
Once you know the market trend, the next thing is to look at the recent price action and find the major swing points that encapsulate the move you want to analyze.
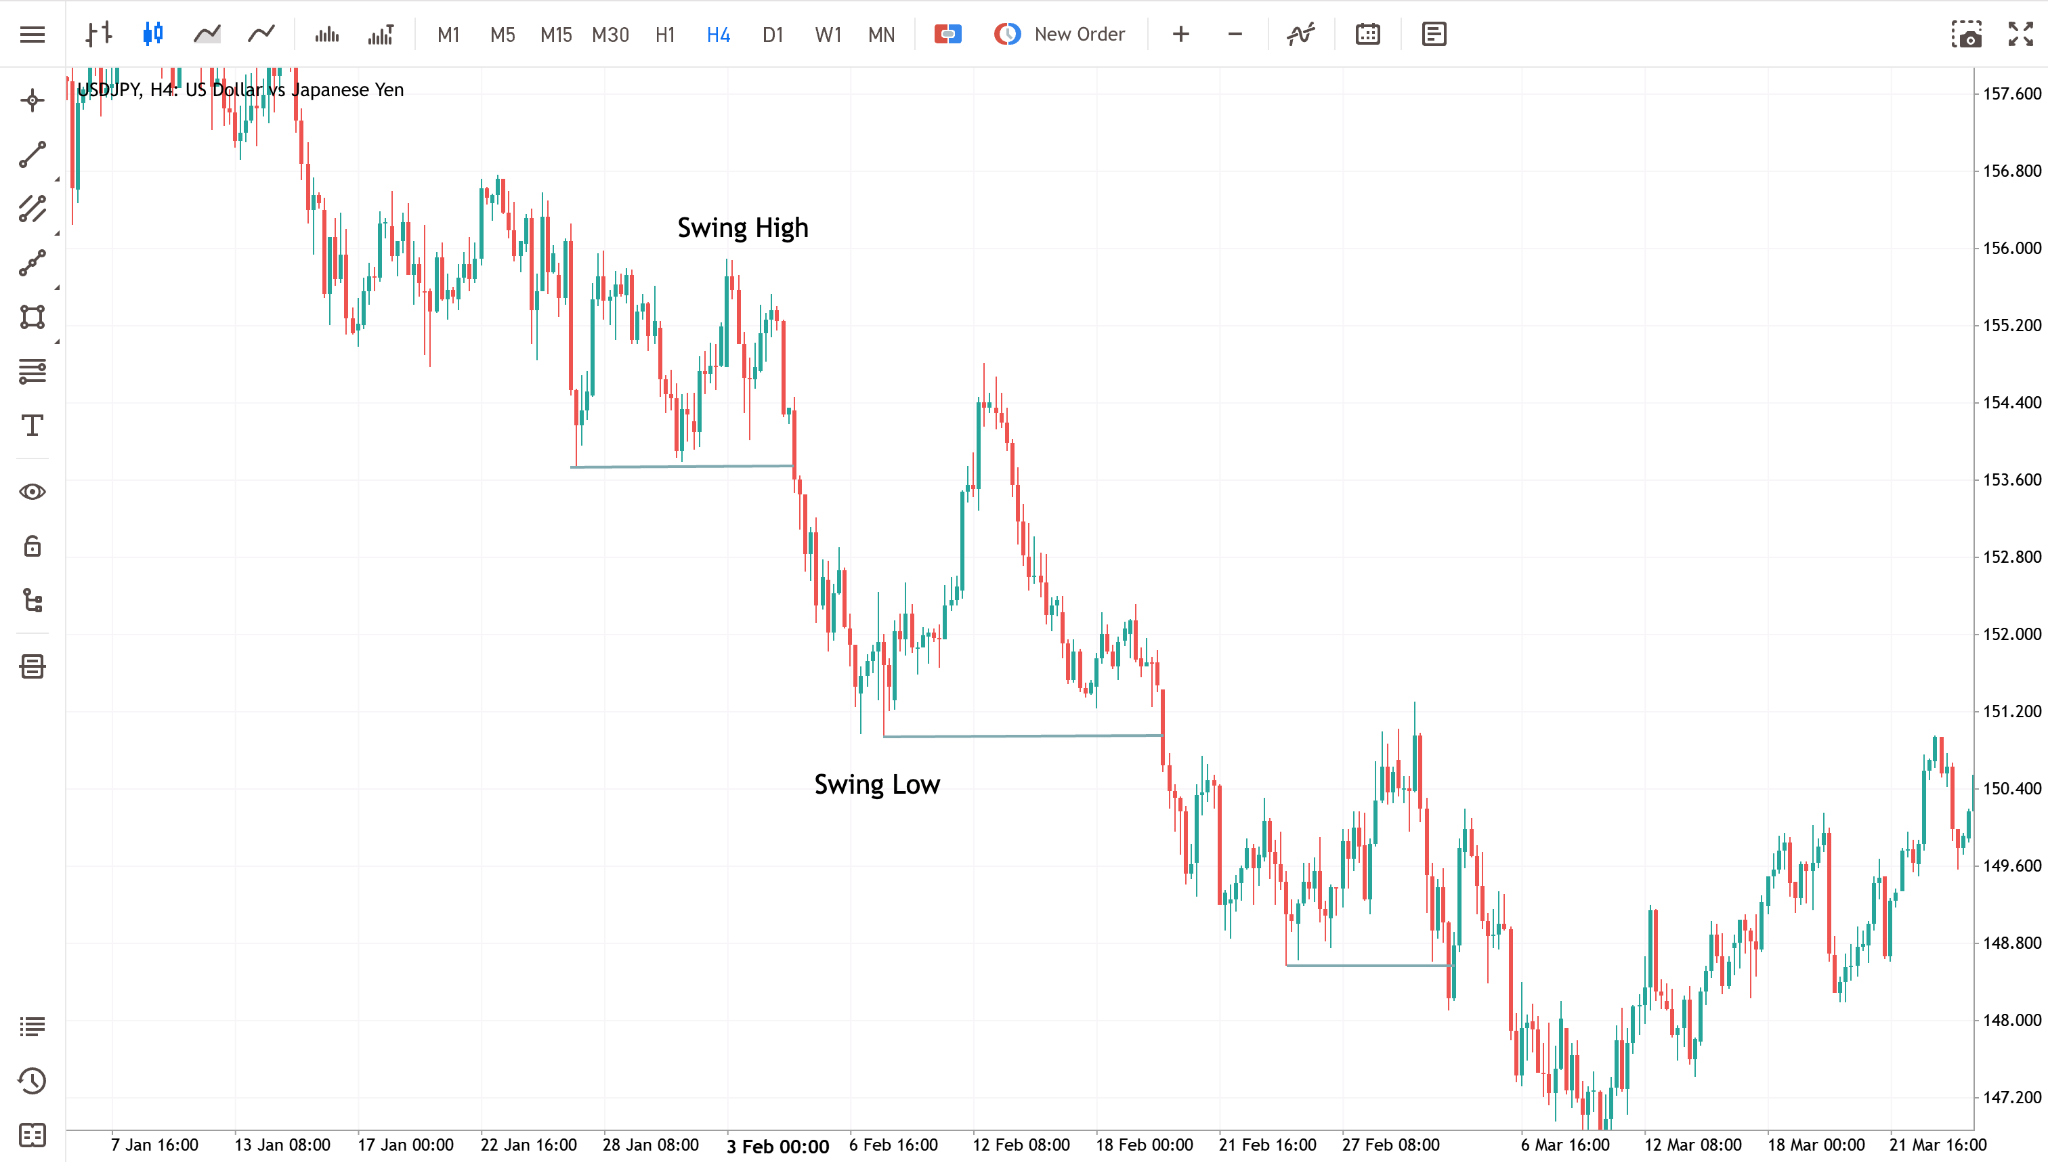
For an uptrend, this means the notable low (swing low) where the rally began, and the subsequent high (swing high) where the rally peaked.
For a downtrend, identify the swing high where the sell-off started and the swing low where it bottomed. Be sure these are meaningful extremes (daily or hourly swings, for example, if you’re trading those timeframes). Beginners often overcomplicate this. You don’t need to fib every tiny wiggle.
Focus on the most relevant leg of the move that the current price is reacting to.
Draw from Low to High (Uptrend) or High to Low (Downtrend)
Grab the Fibonacci Retracement tool on your charting platform. For example, in the above chart, we are in a downtrend. What that means is that you are going to drag the Fibonacci retracement tool from the swing high to the swing low.
For an uptrend, click at the swing low (the beginning of the move) and drag the tool up to the swing high. This will automatically generate horizontal Fib lines at the key percentage levels between those two points.
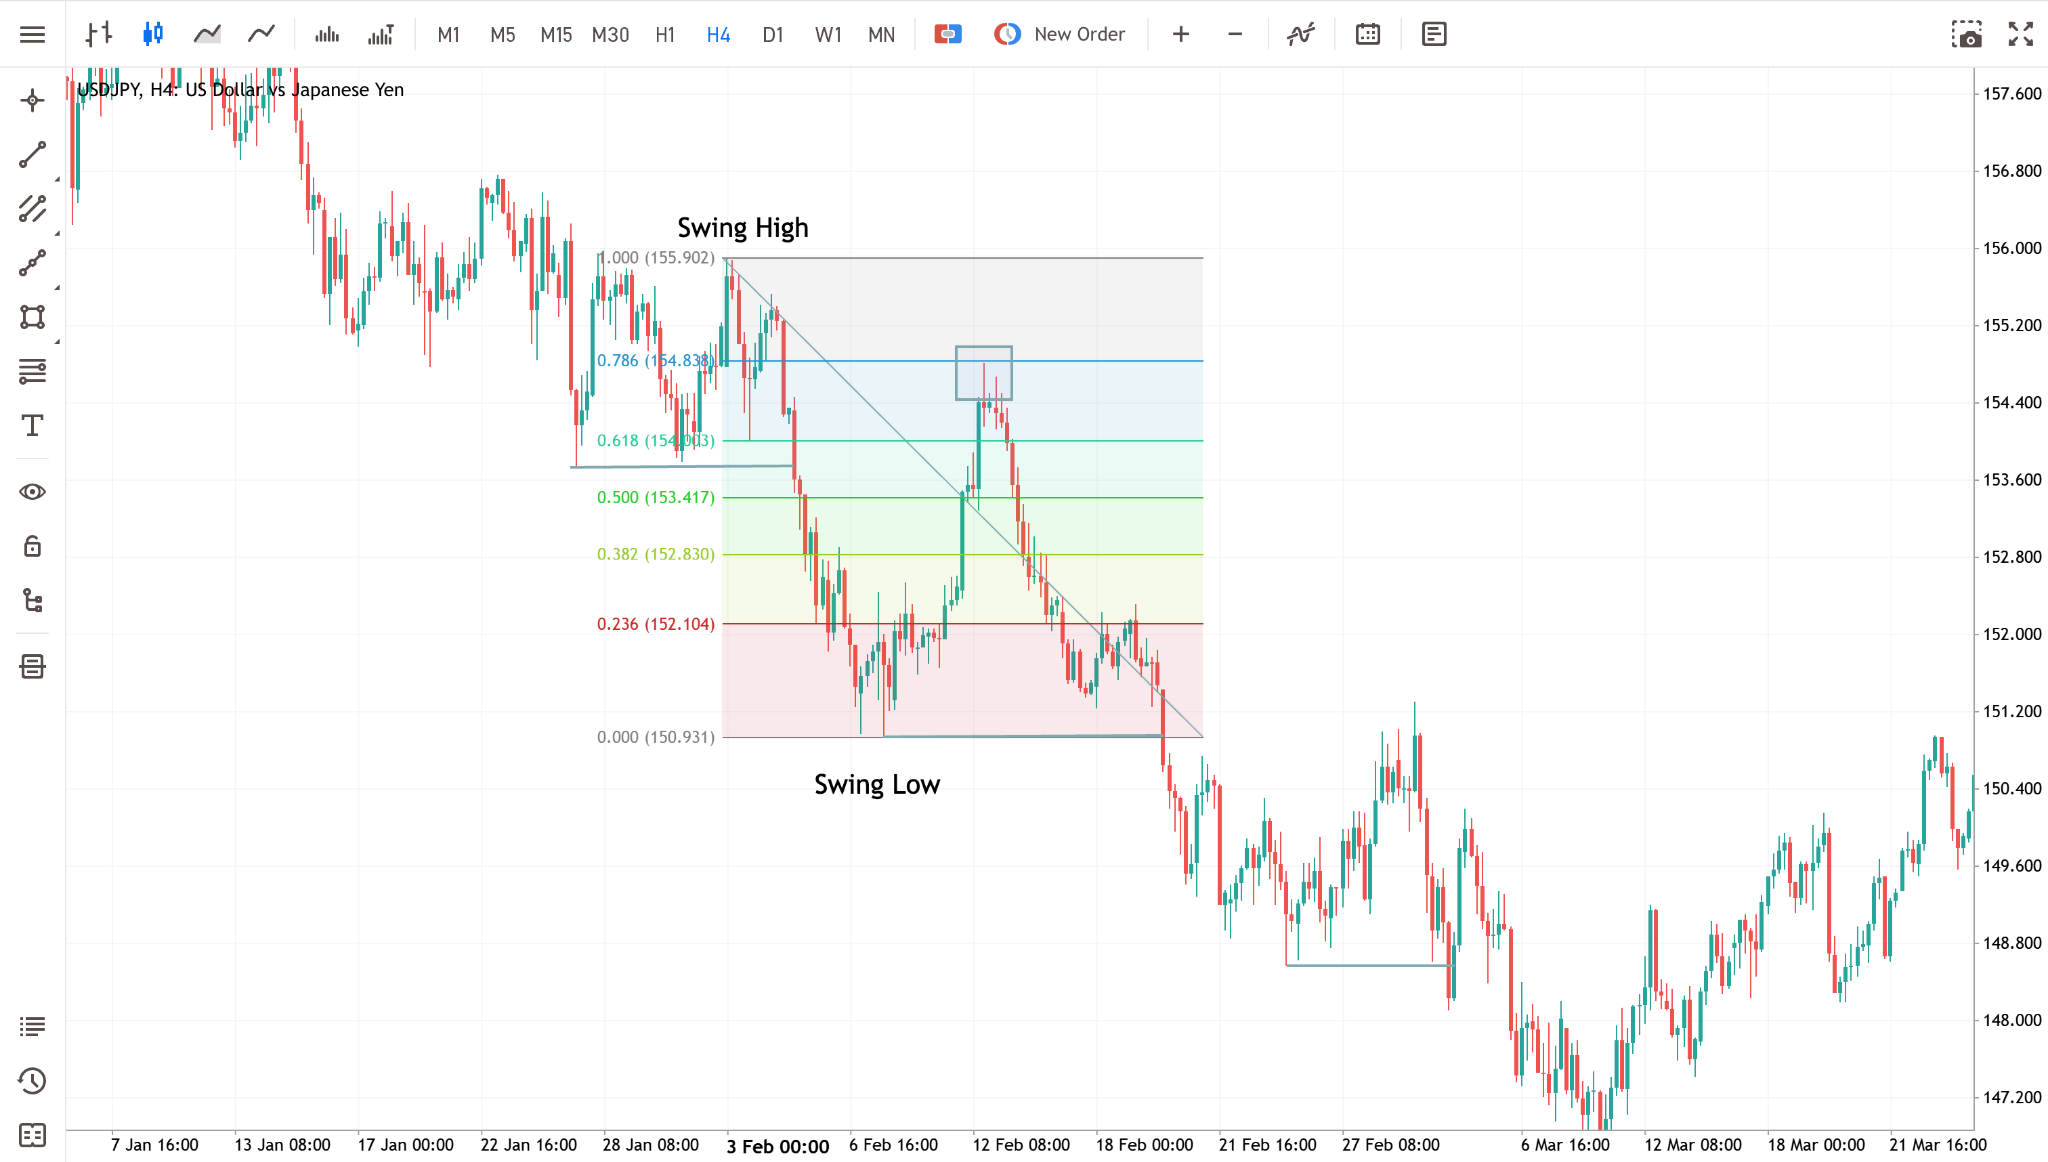
There you go! If you follow these steps, you should be able to draw Fibonacci retracements accurately on your charts.
Now, go ahead and practice on historical charts: identify a prominent swing, draw the Fib, and see how future price action respected (or didn’t) those levels. You’ll likely notice that markets do often react around these fib lines.
That said, let’s now translate this tool into concrete strategies you can start trading right away.
Top Fibonacci Retracement Trading Strategies
Proper technical analysis doesn't stop at merely knowing how to draw Fib levels; you also need to learn how to use them within a solid trading strategy. So, we're going to cover 3 major Fibonacci-based strategies that you can start testing out right away.
1. Fibonacci “Golden Zone” Strategy (50%–61.8% Retracement)
Remember we mentioned the “golden zone” and “golden pocket” earlier? Well, this refers to the area between the 50% and 61.8% Fibonacci retracement levels. The Golden Zone strategy zeroes in on this sweet spot. Instead of using all Fib levels, you primarily wait for price to enter the 50–61.8% corridor, and look for your trade opportunity there.
How To Trade The Golden Zone Strategy
When you spot a significant swing, draw your fib and mark the region between the 0.5 and 0.618 lines. Allow price to retrace into this zone before pulling the trigger.
The Golden Zone strategy assumes a normal healthy correction will reach deeper into 50–61.8%. Focusing mainly on these zones helps you filter out some false signals and potentially get a better entry price.
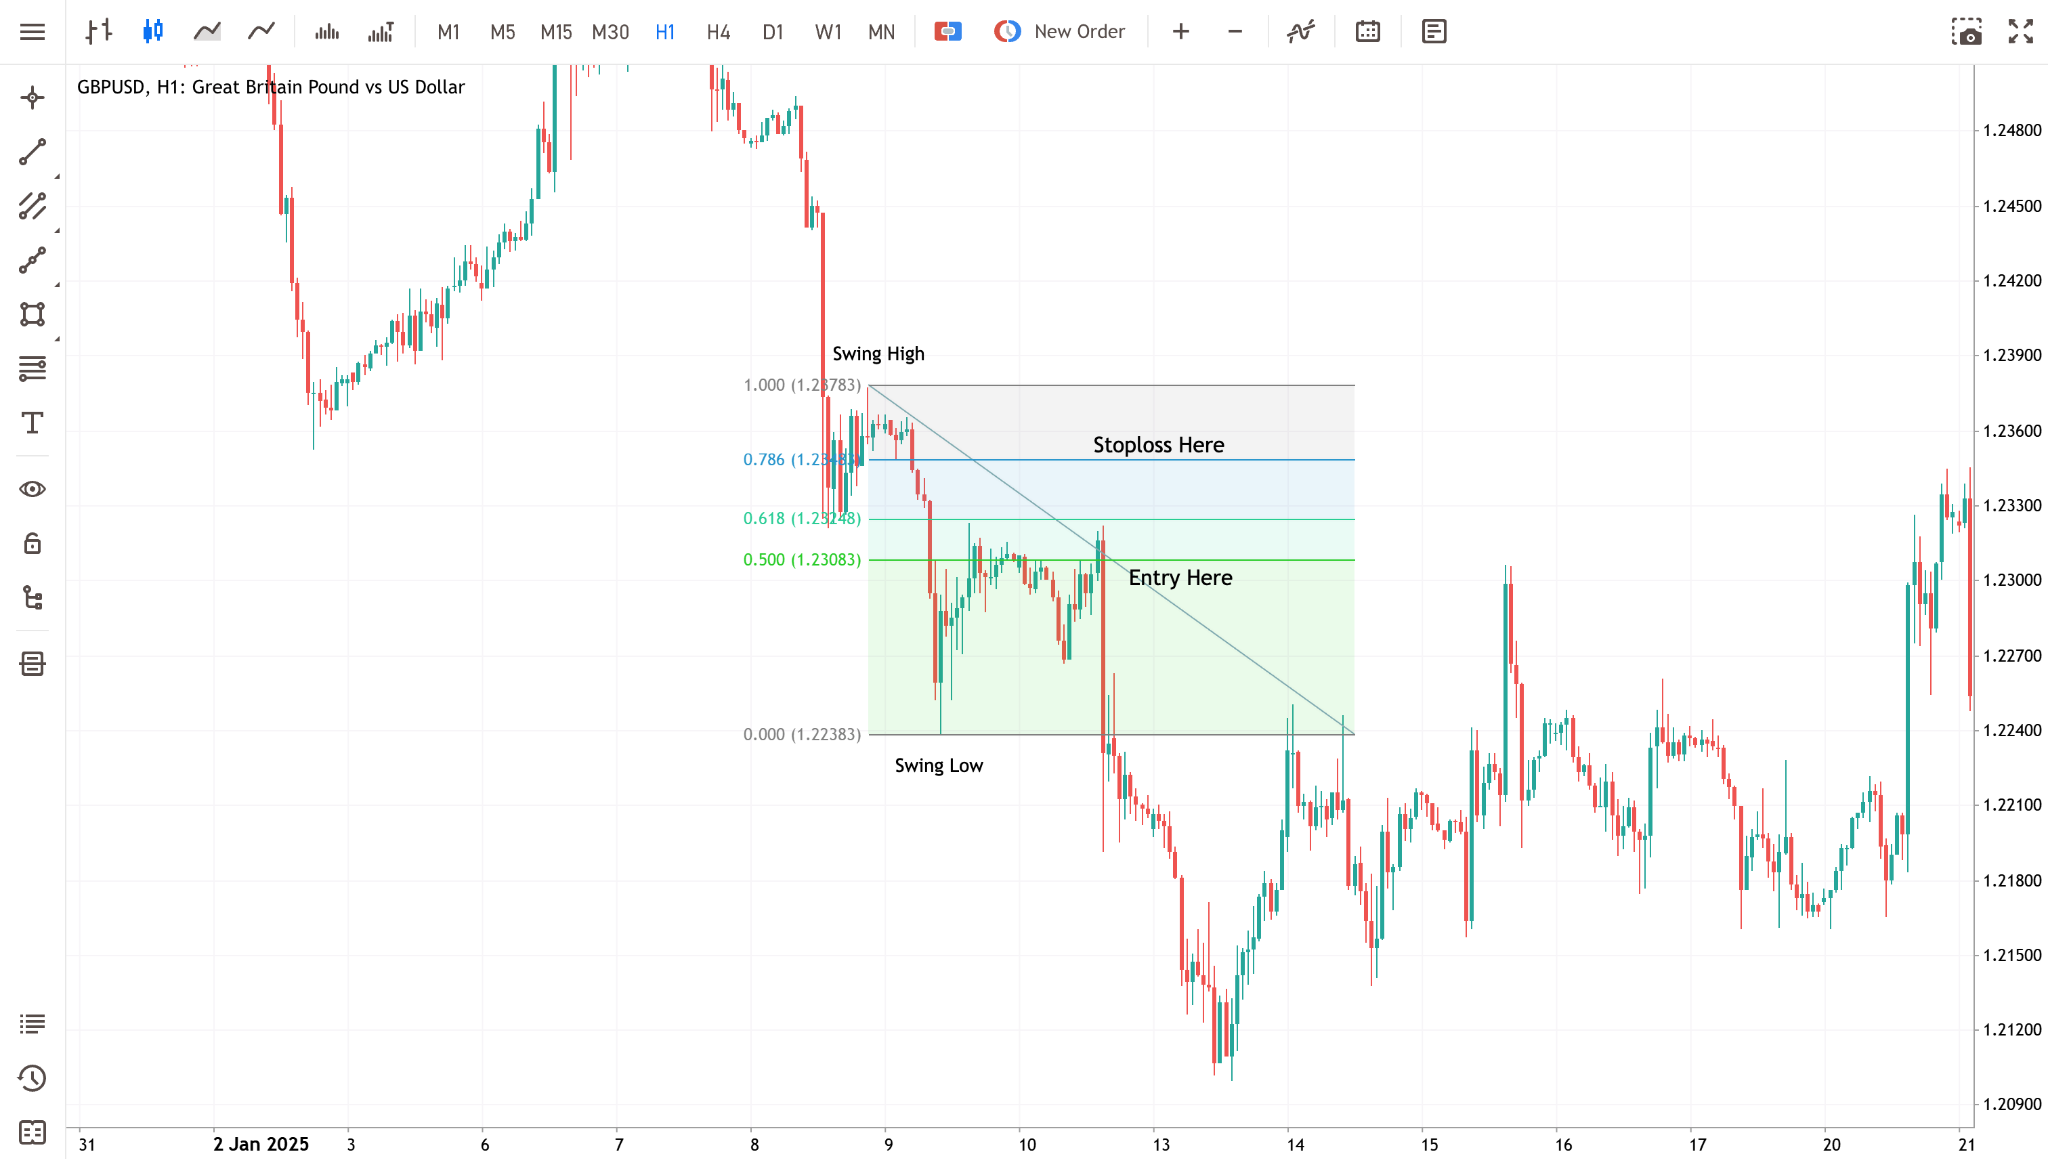
If you notice from the example above, while our entry was at the 50% level, our stop loss was placed at the 78.6% rather than the 61.8%. The reason for this is quite simple: usually, prices often come to the 61.8% before taking off. So, moving the stop loss level to 78.6% significantly increases our win rate.
When trading this strategy, you can always use the opposing swing points as your profit targets. In this case, we will take profit at the swing low.
Overall, the Golden Zone strategy is about stacking probabilities in your favor. You know that zone is watched by many and has a natural significance; by acting there with confirmation, you’re trading in a high-probability area with definable risk.
2. Fibonacci Confluence Strategy
This strategy takes Fibonacci analysis to the next level by looking for a confirmation of a Fibonacci retracement area of interest on the lower timeframe. What does that mean? Let's take a look at the chart below:
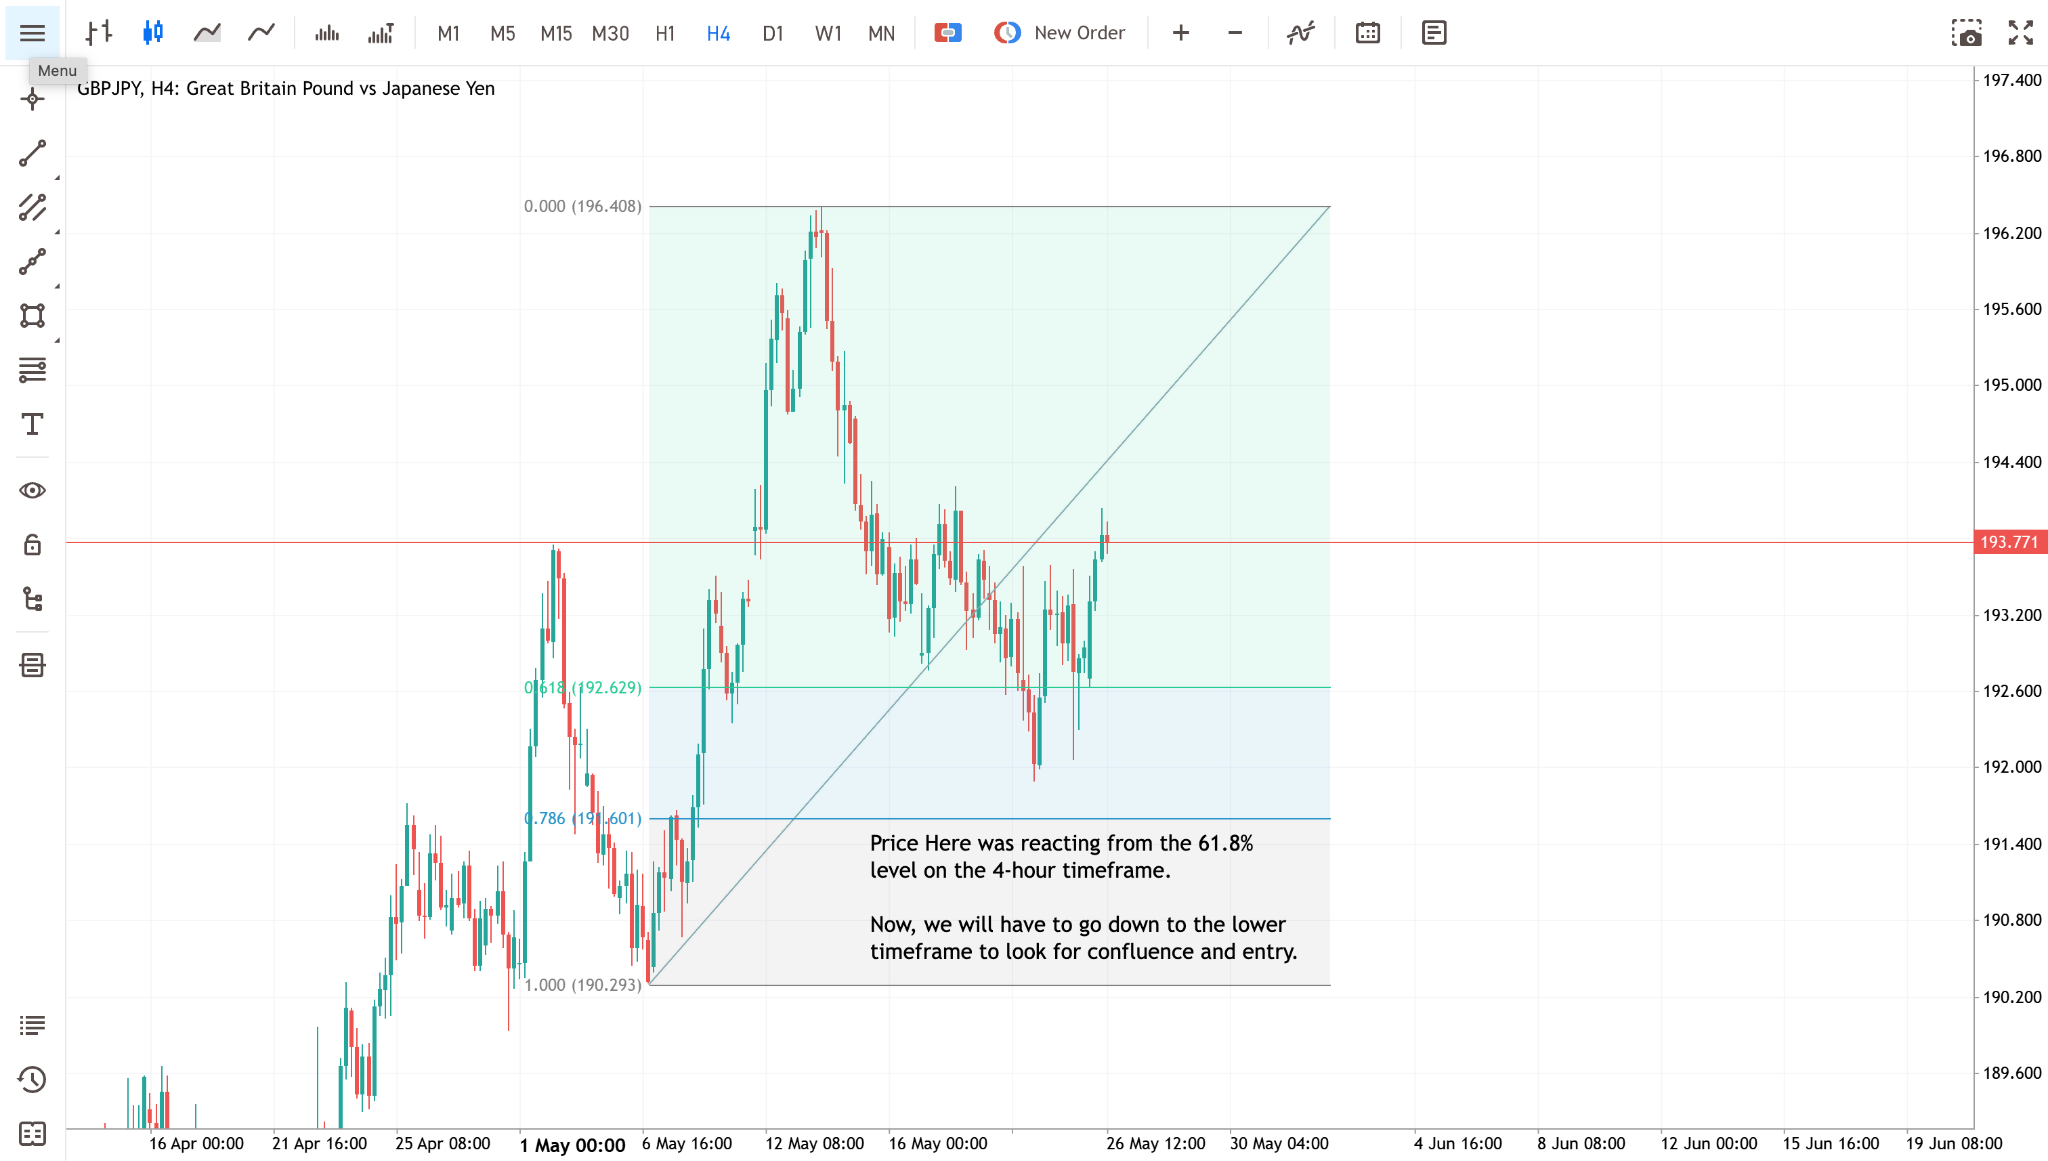
You'll notice that the price is currently reacting to the 78.6% Fibonacci retracement level on the 4-hour timeframe. Usually, a typical trader will open the trade immediately. However, we will approach it a little differently. We will scale down to the lower timeframe and look for another confirmation.
Going down to the lower timeframe does two things. First, it allows us to avoid bad trades since we won't be entering any trades without a confirmation. Second, it significantly increases the risk-to-reward ratio.
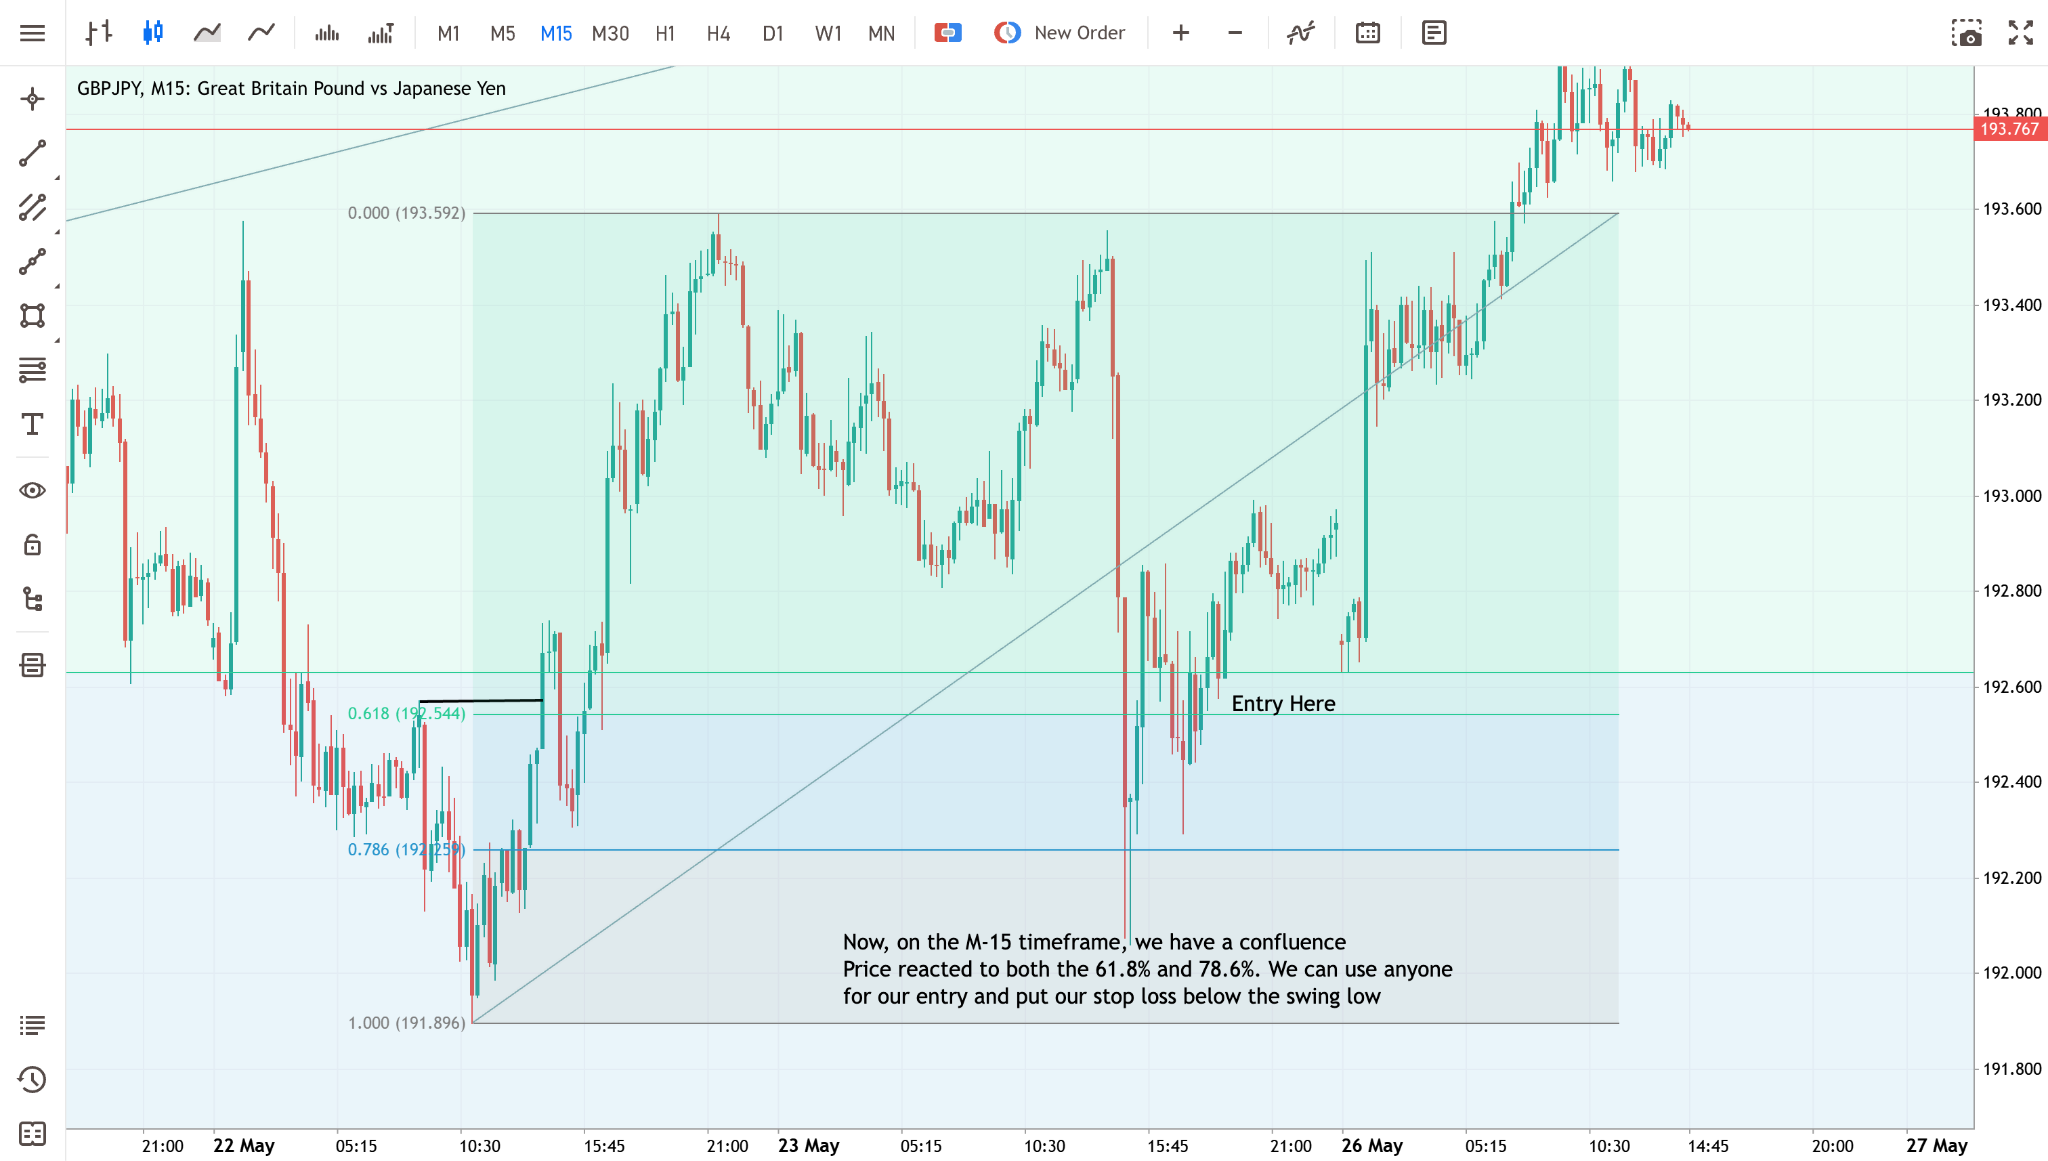
After scaling down to the 15-minute timeframe, the next thing we want to do is to wait for the price to give us another structure on the lower timeframe and then plot our new Fibonacci retracement tool for that timeframe.
Now, when the price comes into that zone (as seen in the chart above), you are especially interested in a trade. Because there’s higher conviction it will hold, you might even choose to increase your position size slightly or be more aggressive in entering (with tight stops). The logic is that a confluence level is more likely to produce at least a tradable bounce.
3. Fibonacci with Confirmation Signals (RSI Divergence, Candlesticks, etc.)
Our final strategy is more of a trading best practice: always pair your Fibonacci levels with a confirmation signal for entry. While this isn’t a standalone “pattern” like the others, it’s so crucial that it deserves to be treated as a strategy in itself. Essentially, you’re adding an extra filter: Only trade a Fibonacci level if you also get a clear indication from price action or technical indicators that the level is indeed holding. This approach can drastically improve the quality of your trades by filtering out false signals.
Candlestick Patterns at Fib Levels
This is one of the simplest and most effective confirmations. If the price dips to Fibonacci support, look for bullish candlestick reversals right at that level.
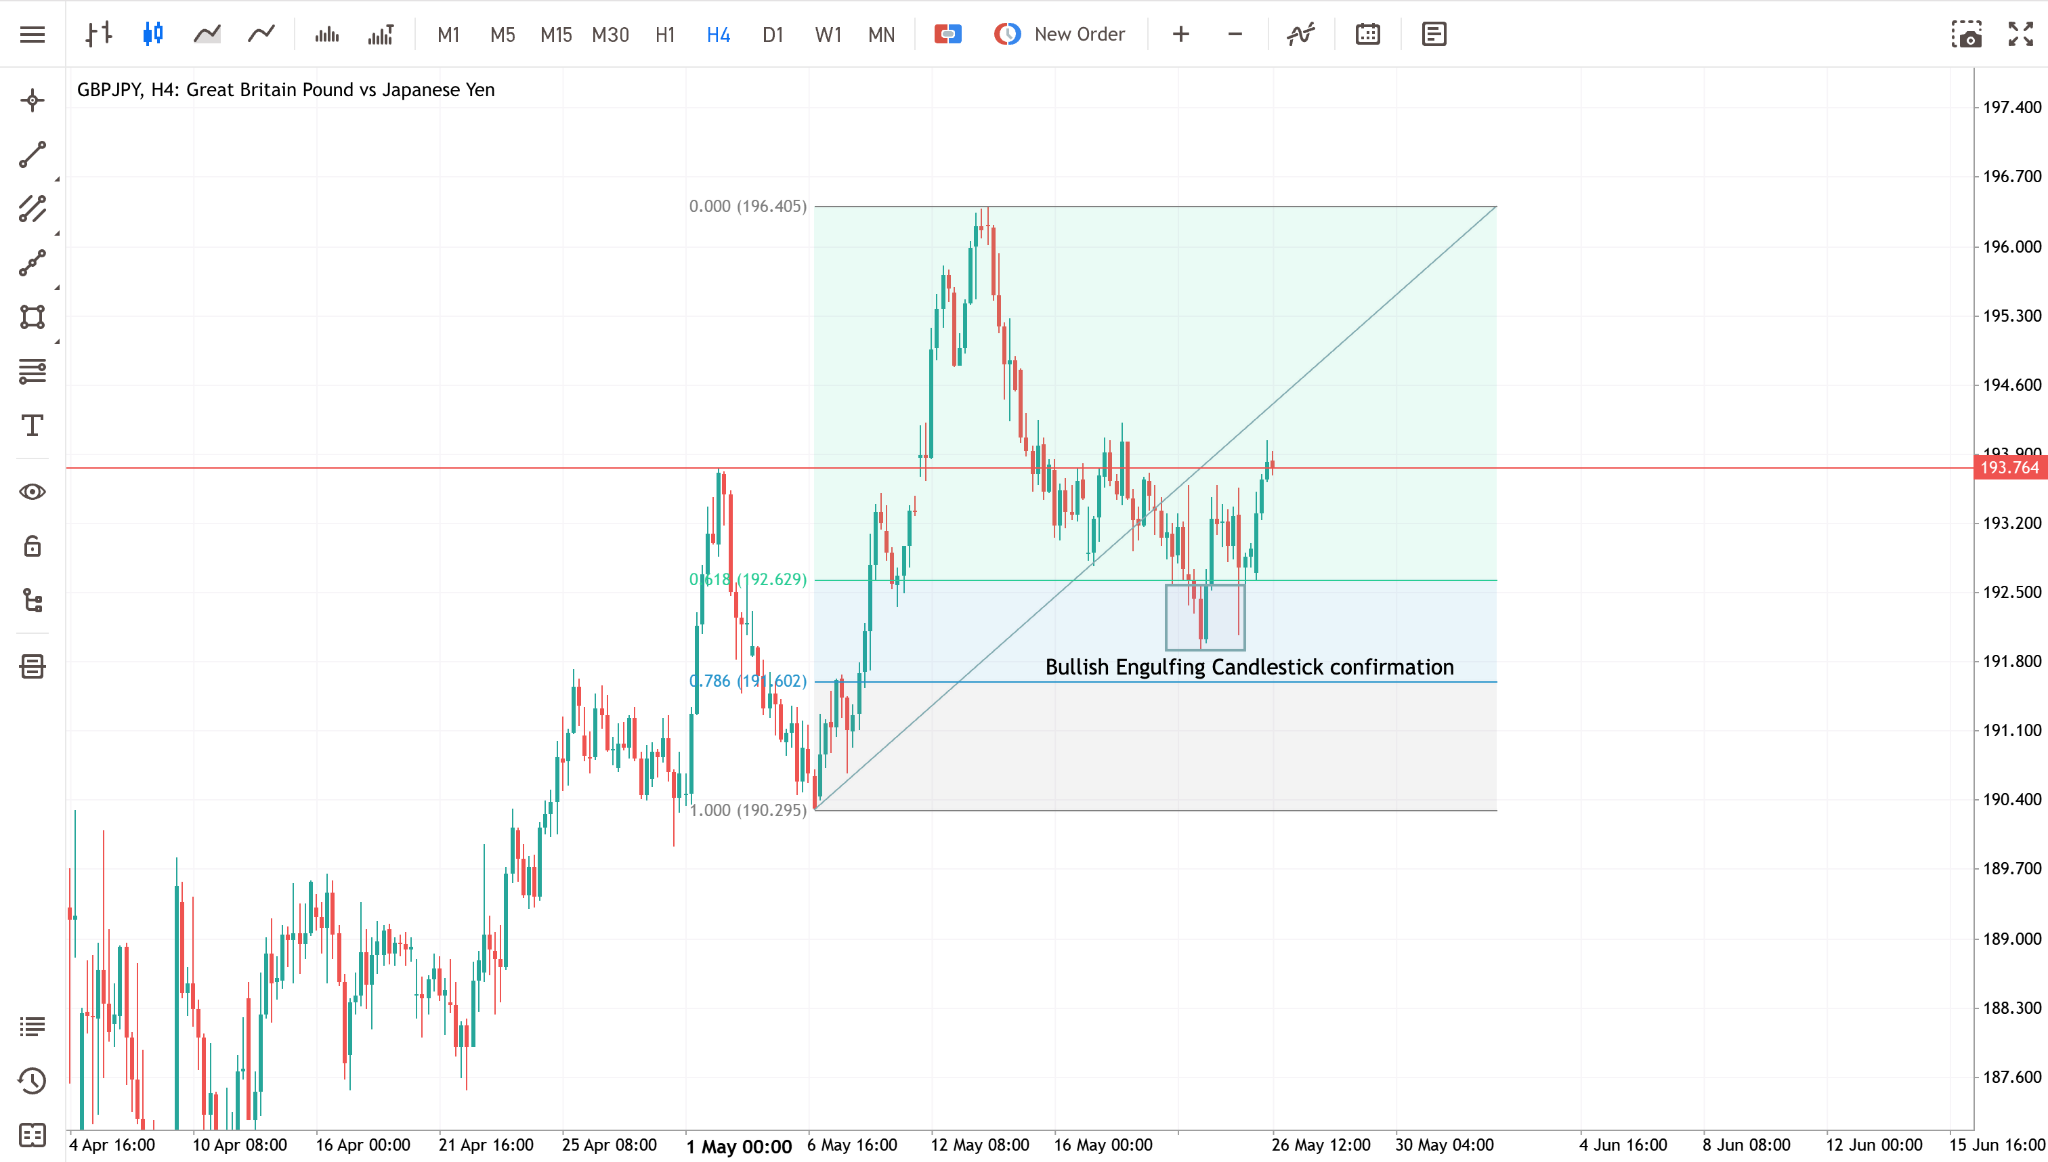
For example, in the chart above, we have a bullish engulfing candlestick pattern as price was touching the 61.8% line. This is a strong sign buyers are defending that Fib support. One thing you should always do is to wait for the candle to close to ensure the pattern is confirmed. Candlestick signals are fast and visual, making them a favorite confirmation tool.
Momentum Indicators (RSI, Stochastics)
Indicators are also important technical analysis tools that can quantitatively signal when a Fib level might hold. A popular confirmation indicator is RSI divergence. Imagine price makes a new low, dipping slightly under a 61.8% Fib support, but the RSI indicator makes a higher low (showing bullish divergence). This is often a giveaway that the down move is weakening and a reversal is imminent, whereas confirming the buy at the Fib support is even better. If RSI is also coming out of oversold territory by then, even better.
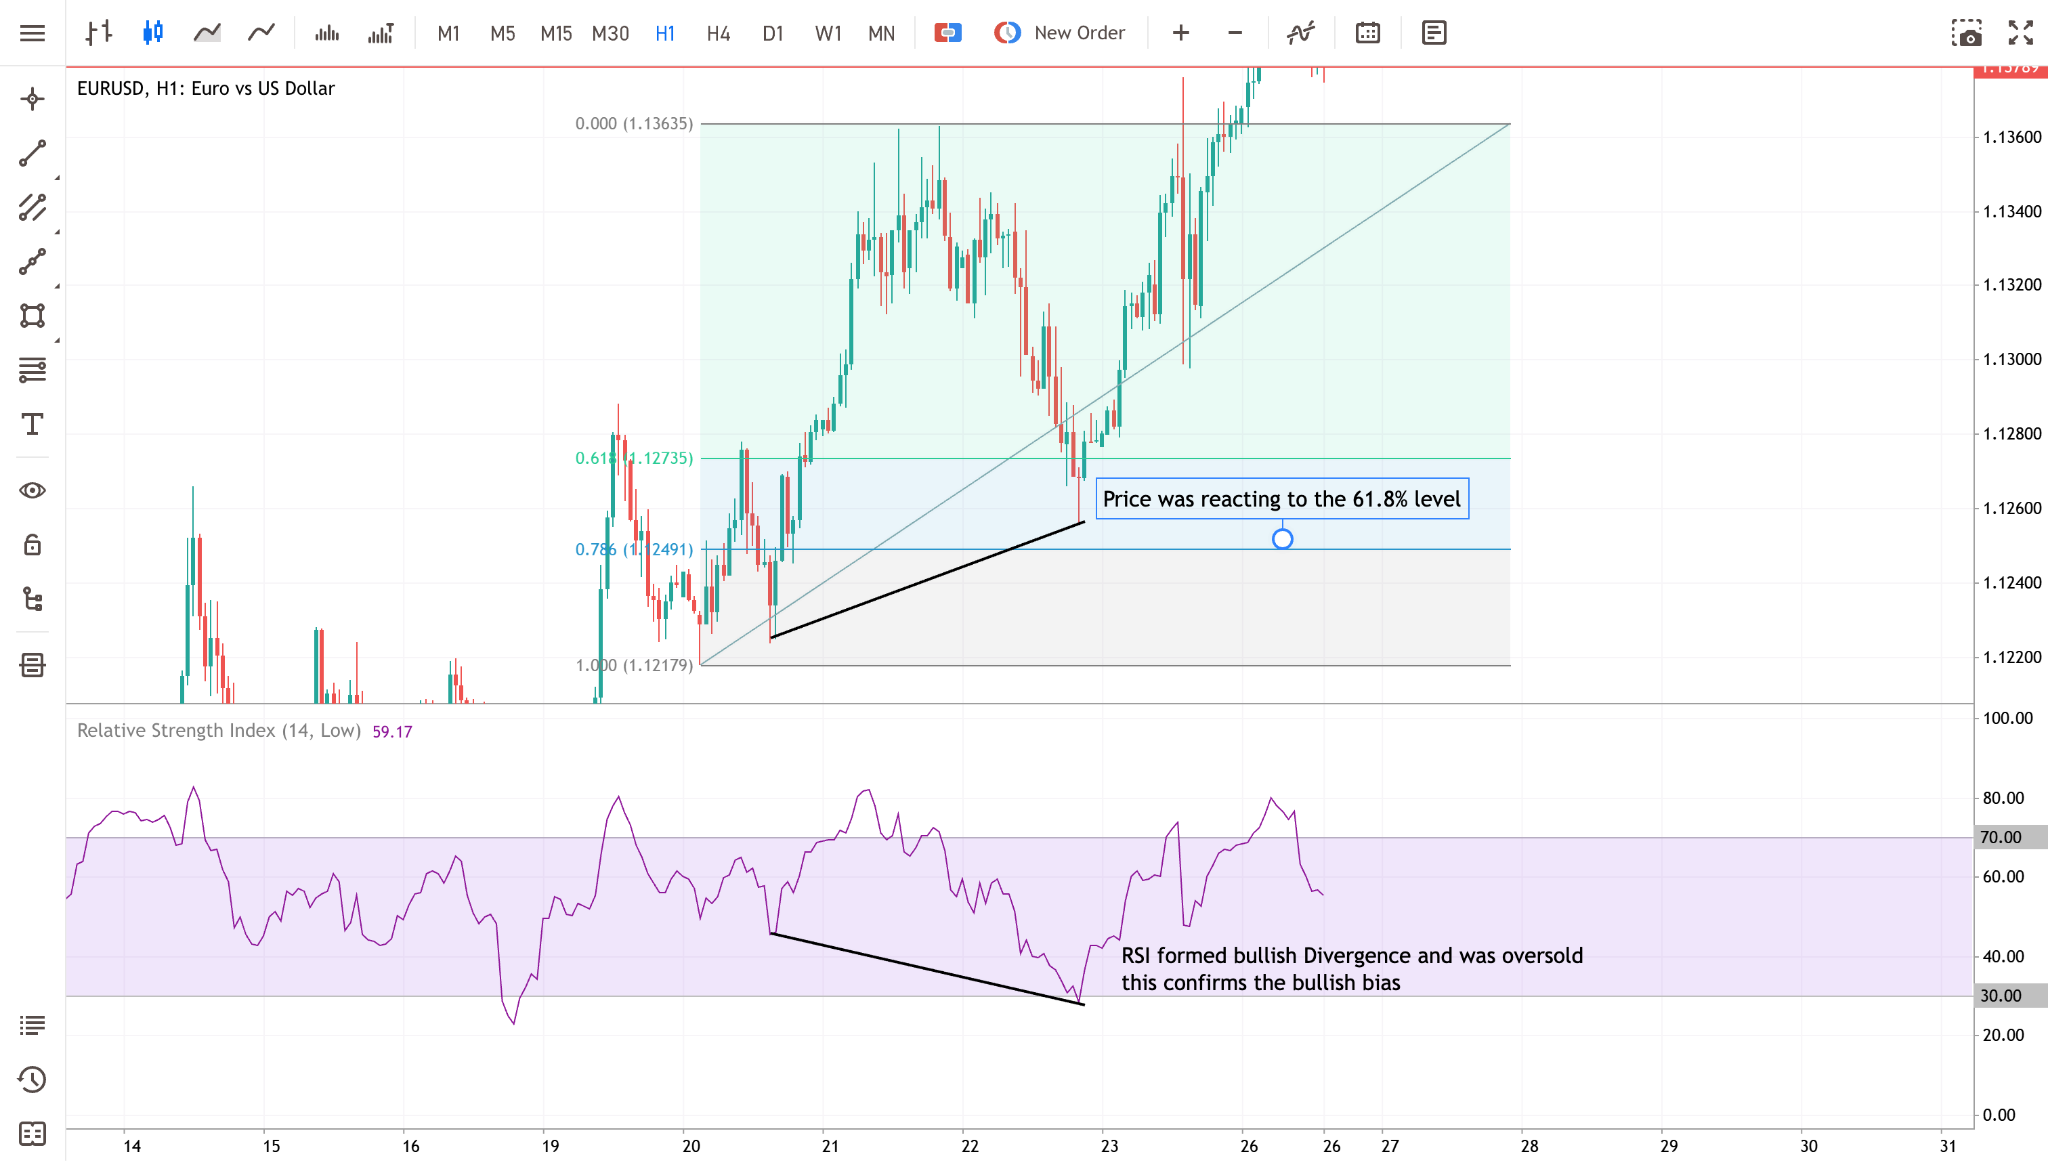
Conversely, in an up retracement to a Fib resistance, if RSI is overbought or shows bearish divergence (price made a higher high relative to an earlier swing but RSI made a lower high), that Fib resistance is likely to hold as a top.
Using the Fibonacci Trading Strategy on an AI Trading Bot
By now you can picture the grind: scanning chart after chart, across dozens of assets, hunting for one clean Fibonacci setup and still missing the best entries while you sleep. You can hand that work to an algorithm instead, and you no longer need to write a single line of code to do it.
Switch Markets’ AlgoBuilder turns a plain-English strategy into a working trading bot in a few clicks. You describe your rules in ordinary sentences; the AI writes the code, backtests it on historical data, and deploys it to trade on your behalf once the results satisfy you. From then on, the bot watches the market around the clock and executes every valid setup to the letter.
Why Use an AI Trading Bot for Fibonacci Strategies?
Three reasons stand out. Let’s quickly go over them:
- It trades without emotion. A bot never hesitates to sell into a panic or hold when others turn greedy. It follows your Fibonacci rules exactly and never second-guesses the plan. Fibonacci trading demands that discipline, and a bot supplies it by default.
- It watches the market around the clock. You cannot sit at the screen all day and night; a bot can. It monitors many pairs at once and acts the instant a Golden Zone entry appears, so the 3 a.m. reversal on EUR/USD no longer slips past you. To keep it running without interruption, pair it with a VPS.
- It backtests in seconds. Before you risk a cent, you can test your Fibonacci rules against real market history and read the verdict, such as the win rate, equity curve, drawdown, and profit factor. Change one parameter, rerun, and compare. Minutes of this replace weeks of manual trial and error, and every decision now rests on data.
How to Build Your Fibonacci Bot on Switch Markets’ AlgoBuilder
AlgoBuilder has been rebuilt around one idea: describe the strategy, and let the AI handle the rest. You never touch code. To follow along, open the AlgoBuilder page. Here is the workflow from first sentence to live trade.
1. Describe your strategy in plain English
Type your idea into the box exactly as you would explain it to another trader. Name the asset, the Fibonacci level, the date range to test, the risk-reward ratio, and the risk per trade. For example:
Run a Fibonacci retracement strategy on Gold, using the 78.6% level, Jan–December 2025, risk-reward 1:2, risking 1% per trade.
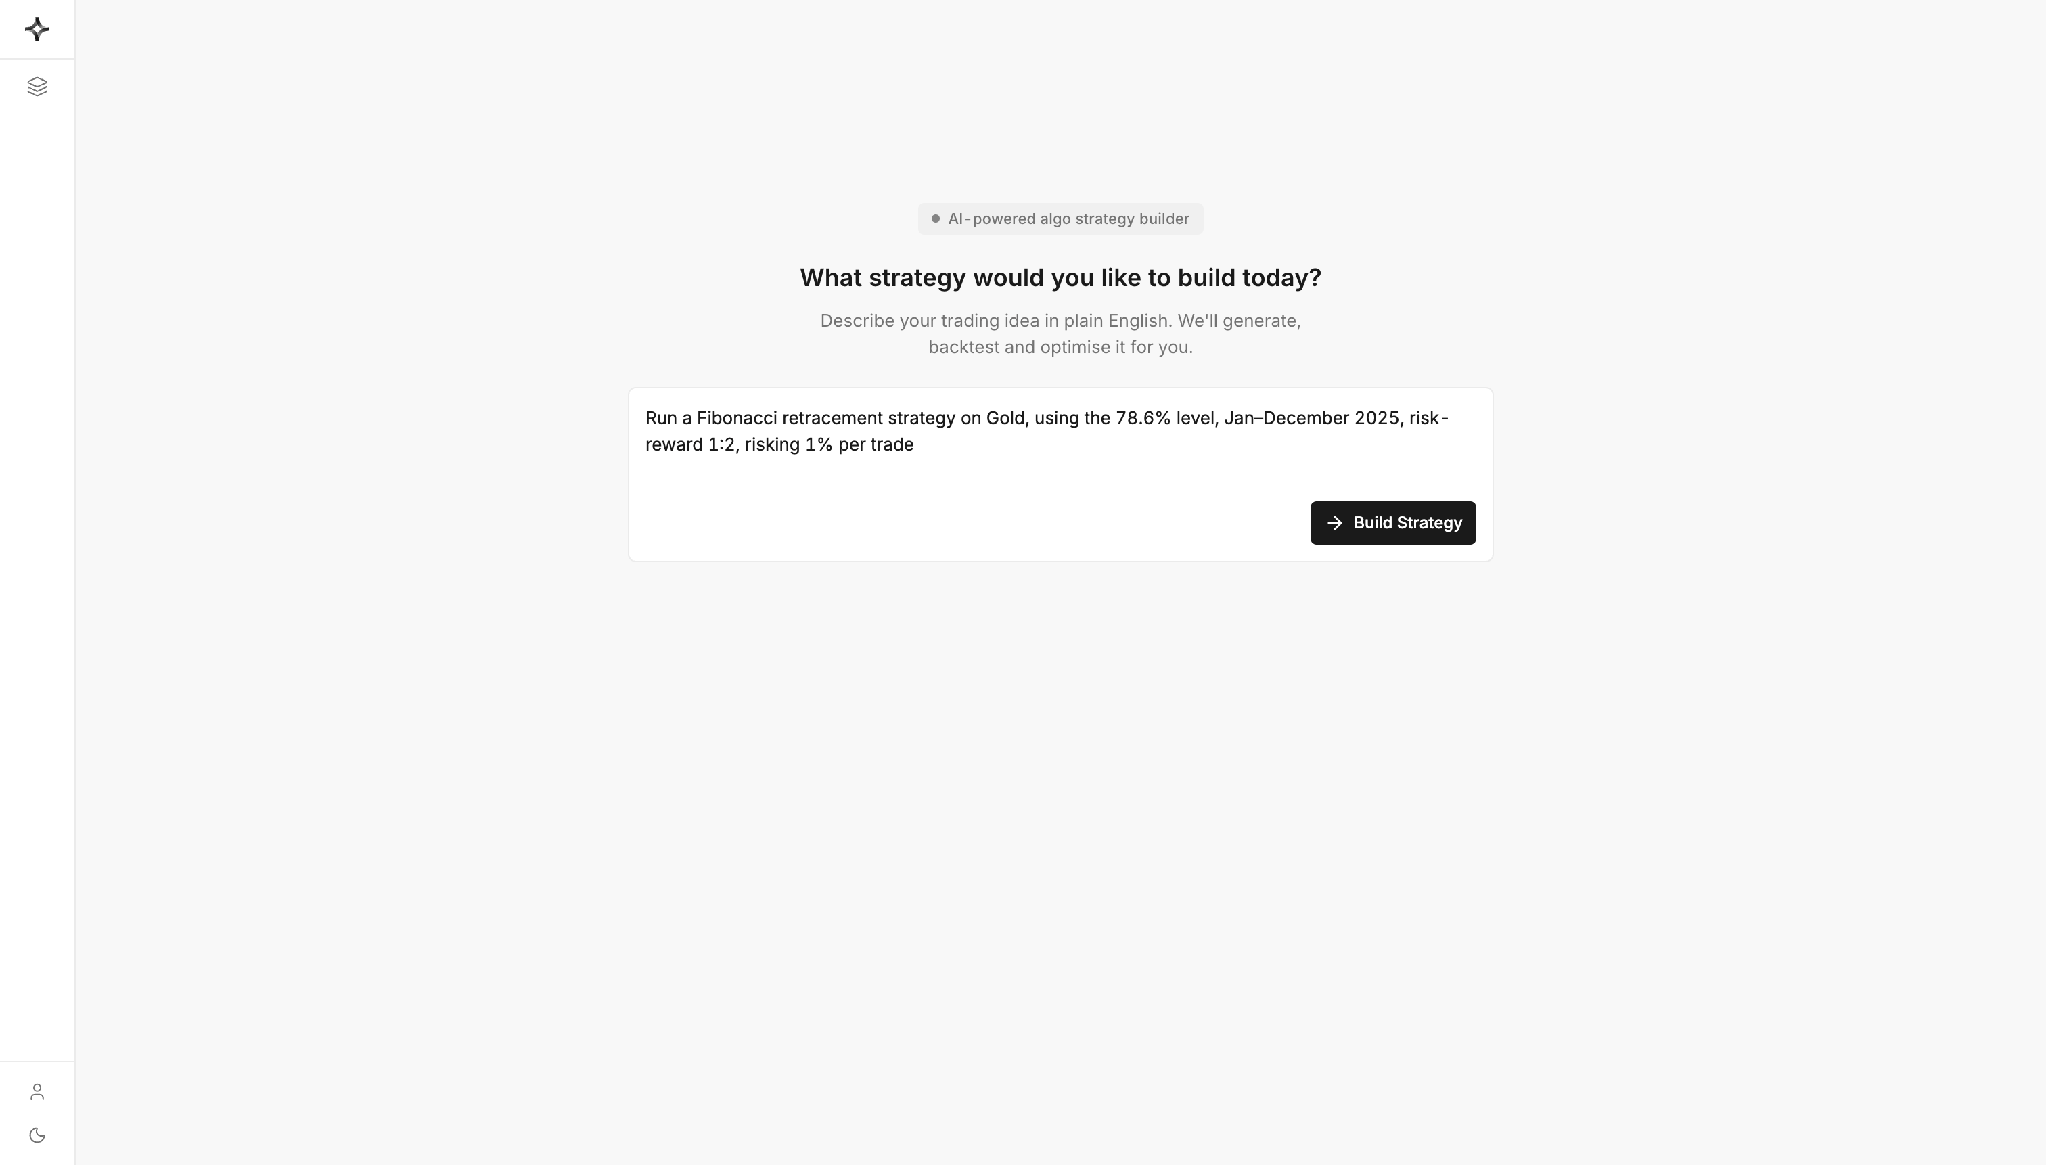
Keep it this simple, or layer in the confirmations you learned earlier. The sharper your description, the closer the bot tracks your intent. Set your risk per trade deliberately, then click Build Strategy.
2. Let AlgoBuilder generate the code and run the backtest
One click now does what once took several steps. AlgoBuilder writes the trading code for your rules and runs it against historical price data, working visibly through “Generating Trading Code” and “Running Backtest” in the chat panel. The code stays out of your way, though you can open the Code tab and read it whenever you like.
3. Read the results in the Visual Backtester
When the run finishes, the Visual Backtester shows how your strategy performed. The chart replays each trade on the candles that triggered it, and the results panel reports the headline numbers at a glance: return, net profit, win rate, and maximum drawdown. The Gain (%) curve tracks realised profit against floating equity across the period, while the Trades, Logs, and Code tabs hold the detail behind every figure.
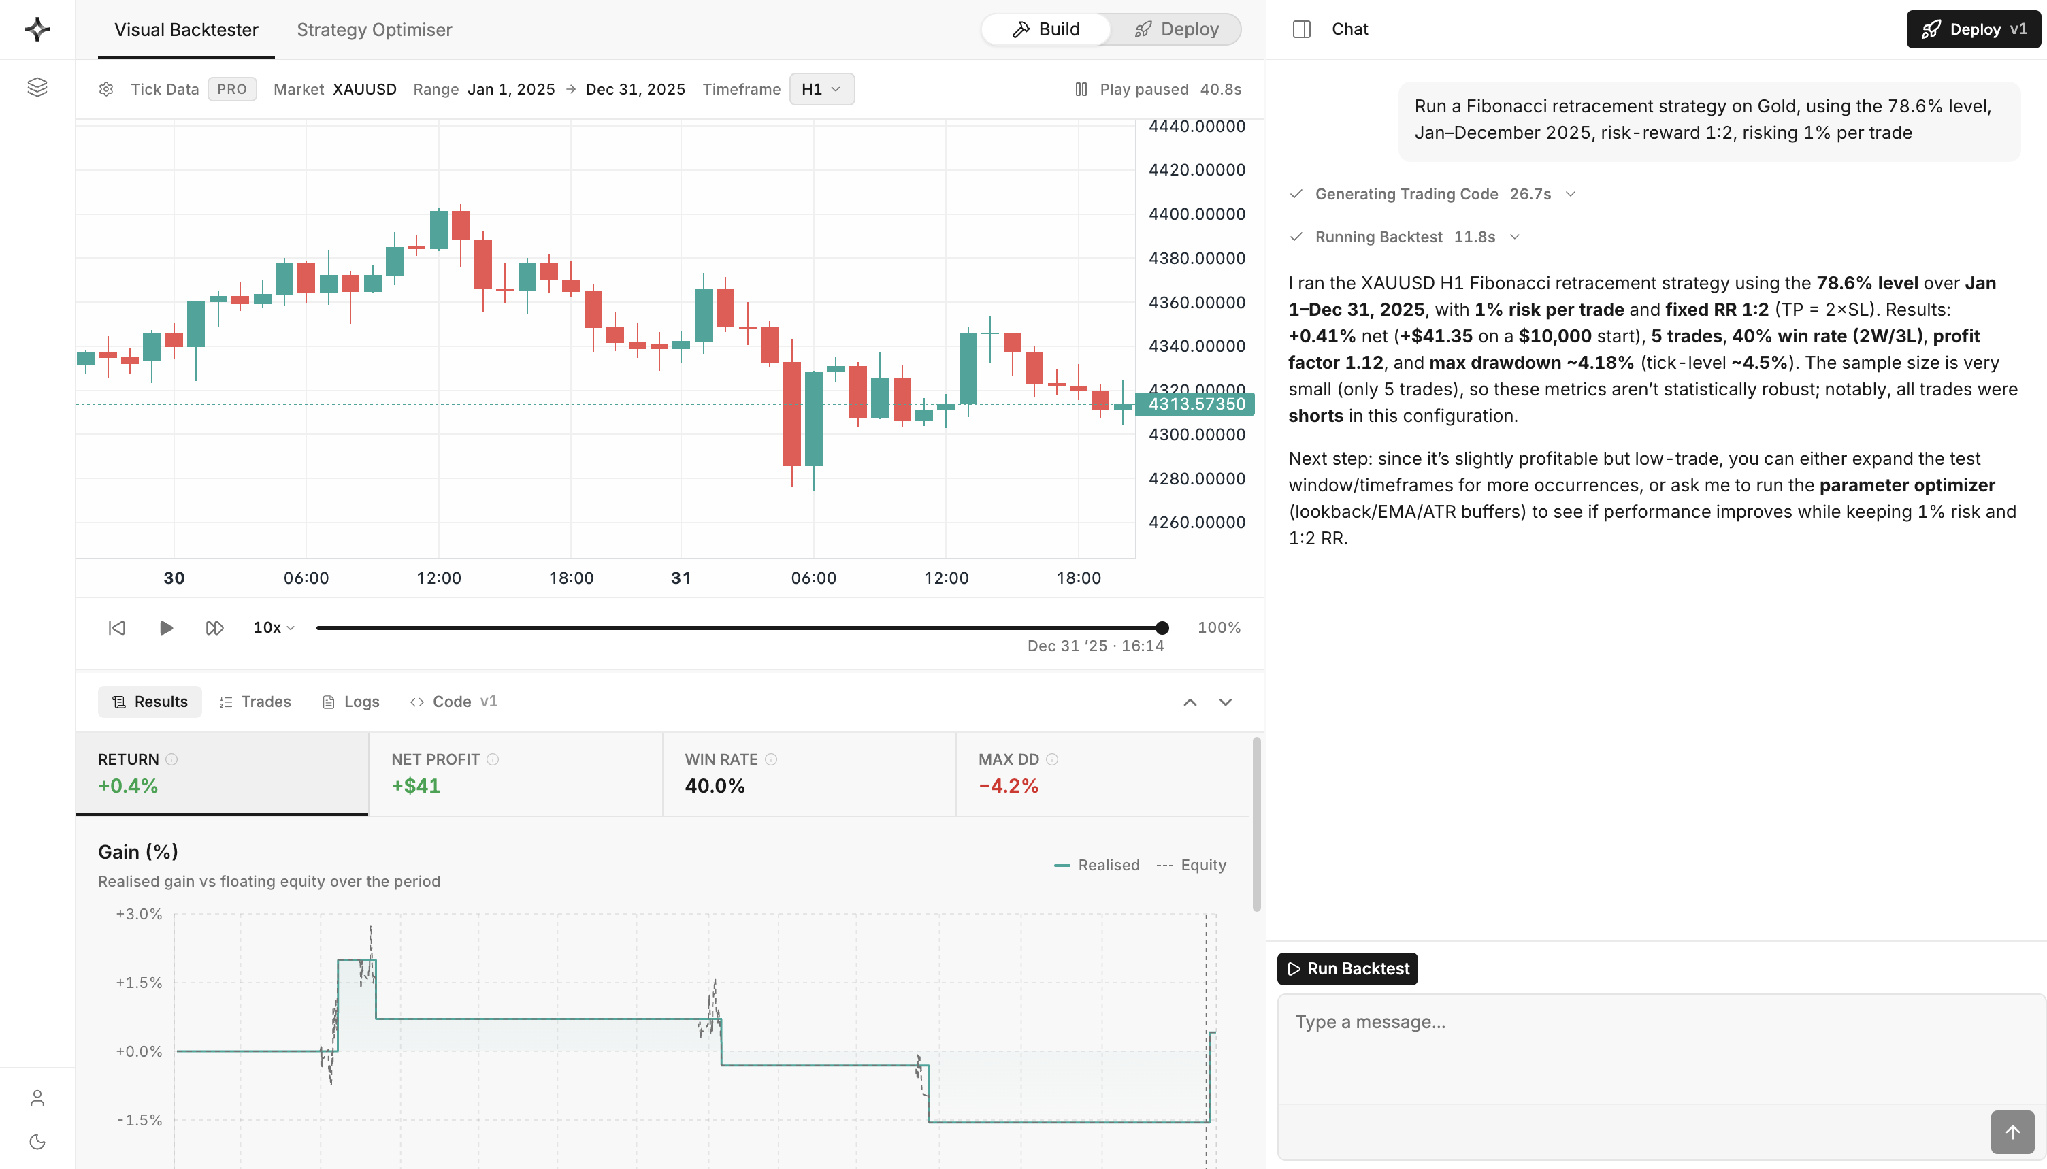
AlgoBuilder also reads the results back to you in plain English and flags what matters. In the Gold example above, the strategy returned +0.4% from 5 trades at a 40% win rate, and the assistant is quick to note that 5 trades is far too small a sample to trust and that every trade was a short.
4. Refine and optimize
Few strategies work on the first pass. To sharpen this one, take either of two paths. Type a follow-up in the chat. For instance, you can widen the date range, add a timeframe, or loosen a condition, and AlgoBuilder rebuilds and reruns on the spot. Or open the Strategy Optimizer and let it tune the parameters for you, sweeping the lookback, EMA, and ATR buffers for stronger results while it holds your 1% risk and 1:2 reward fixed. Rerun, compare, and repeat until the numbers earn your trust.
5. Deploy and go live
When the backtest satisfies you, click Deploy. AlgoBuilder saves the strategy to your Deployed Strategies list ready to run.
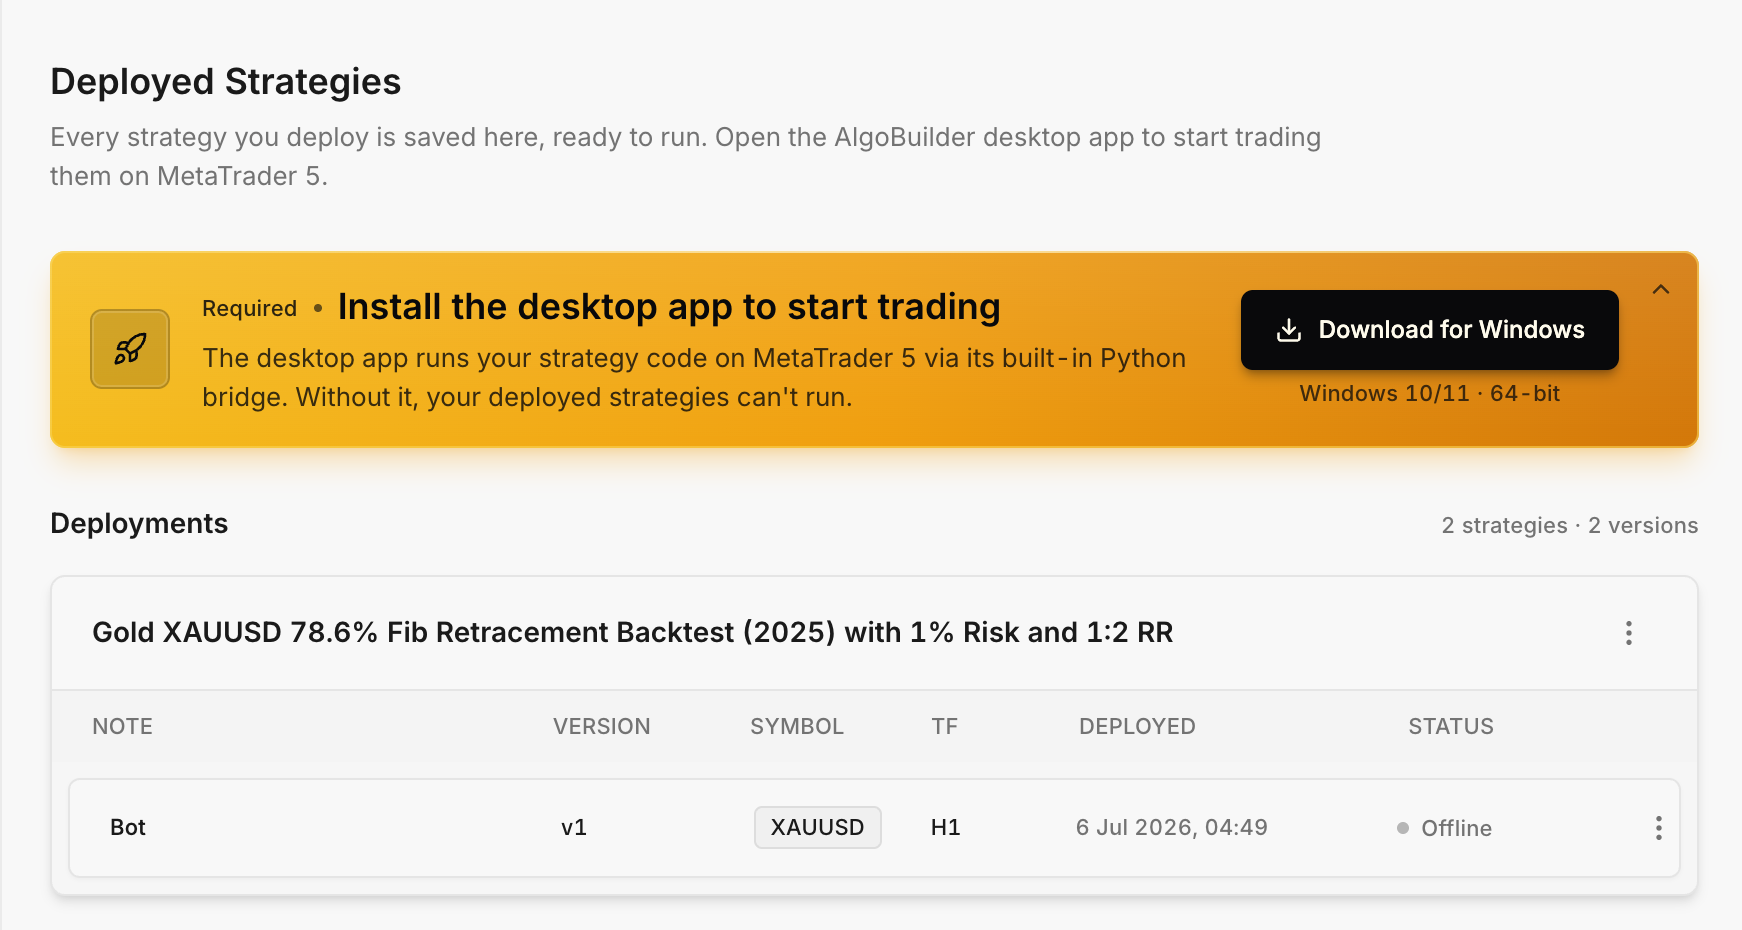
One piece connects the bot to the market: the AlgoBuilder desktop app. Download it (Windows 10/11, 64-bit), and it runs your deployed strategy on MetaTrader 5 through a built-in Python bridge, so no files change hands and no code needs editing. Without the desktop app, your strategies stay offline, so install it, connect your MT5 account, and switch the bot on when you are ready.
Key Takeaways
Here are the key takeaways to keep in mind regarding using Fibonacci trading strategies:
FAQs
So, before you head off to apply what you’ve learned, here are some quick answers to the most common questions traders ask about Fibonacci strategies.
What is the Python Fibonacci trading strategy?
“Python Fibonacci trading strategy” isn’t a unique strategy per se – it generally refers to implementing a Fibonacci-based trading strategy using Python code (for example, in an algorithmic trading script or bot). In essence, it’s the same concepts of trading off Fibonacci retracement levels and extensions, but automated through programming.
Many algo traders use Python to backtest and execute strategies that buy or sell when the price hits certain Fibonacci levels. For instance, one might code a Python script to scan many stocks and automatically place trades when a 50% retracement aligns with other bullish signals. The advantage of doing it in Python is that you can systematically test the strategy on historical data and deploy it live with speed.
What is the strongest Fibonacci retracement level?
The 61.8% retracement (the golden ratio) is widely regarded as the strongest and most significant Fibonacci level. Traders and analysts pay special attention to it because the price often has dramatic reactions there. A 61.8% retracement represents a deep correction of a move, and if the original trend is to continue, this is a common spot for the reversal to happen.
What are the disadvantages of the Fibonacci trading strategy?
While Fibonacci tools are widely used, they’re not without limitations. One major drawback is subjectivity. For instance, different traders may choose different swing highs and lows, leading to inconsistent levels and results. Fib levels also aren't guaranteed to hold; in real-time, price can easily cut through them, especially in news-driven or choppy markets. That’s why relying solely on Fibonacci without additional confirmation can be risky, particularly for beginners who treat them as magic levels.
Moreover, Fibonacci strategies are purely technical with no fundamental backing, and crowded Fib zones can even attract stop-hunting by smart algorithms. Despite these drawbacks, Fibonacci tools remain effective when used as part of a broader strategy with proper risk management and flexibility. The key is to treat them as helpful guides and combine them with experience and other trading tools for better reliability.
Risk Disclosure: The information provided in this article is not intended to give financial advice, recommend investments, guarantee profits, or shield you from losses. Our content is only for informational purposes and to help you understand the risks and complexity of these markets by providing objective analysis. Before trading, carefully consider your experience, financial goals, and risk tolerance. Trading involves significant potential for financial loss and isn't suitable for everyone.