What Is Fundamental Analysis and How Can You Use It in Trading?
Fundamental analysis is an analysis method that evaluates an asset’s financial health and economic factors to determine its true value. Traders use this method to identify the intrinsic value of an asset, enabling informed decisions on buying, holding, or selling.
So, what is fundamental analysis, why is it so important, and how can you use it in trading? In this guide, we’ll answer these questions and assist you in getting the right information and tools to analyze the markets using fundamental analysis. Take note that in this guide, we focus on fundamental analysis across all markets, including stocks, FX currency pairs, commodities, and digital assets.
Key Takeaways
What is Fundamental Analysis?
Fundamental analysis assesses the true worth of a financial asset using its financial data and economic indicators. Unlike technical analysis, which focuses on price movements and trading volumes, fundamental analysis seeks to determine the intrinsic value of an asset by examining key financial metrics and macroeconomic factors.
In essence, fundamental analysts delve deep behind the scenes of an asset. For example, when referring to stocks, then a company’s financial statements, management quality, and industry positioning can be valuable in uncovering its real value. In forex trading, the economic growth, projections of interest rate changes, and geopolitical developments can help in assessing the value of a currency. In commodities, economic growth, supply and demand, production/consumption, and weather disruptions have a huge impact on a commodity’s value.
An example of fundamental analysis can be the release of a company's earnings report. When a company releases better-than-expected revenue or EPS, then the stock is likely to rise, and vice versa. Another example can be found in economic data such as CPI, GDP, or the Non-Farm Payrolls. For instance, when a higher-than-expected CPI figure is released, the stock market is likely to fall as central banks are likely to increase interest rates. A higher interest rate typically means that stock markets can fall.
A currency pair can also be affected by these indicators, since capital moves from one place to another. Rates and stability are the key factors for investors to move capital in and out of a country or a region. When the projections of a rate hike increase, the currency is likely to appreciate and vice versa. At the same time, when the geopolitical situation is not stable, financial institutions and investors often move their capital to a more stable country.
For these reasons, retail traders monitor economic events, central banks' events and announcements, officials' speeches, and any geopolitical developments that may indicate the intrinsic value of financial assets.
The ultimate goal of fundamental analysis is to determine the intrinsic value of an asset to identify whether it is undervalued or overvalued.
Key Components of Fundamental Analysis
Fundamental analysis involves evaluating the underlying factors that influence the value of an asset, and its key components vary slightly across different markets but follow a common framework.
In the stock market, the core components include an in-depth analysis of a company’s financial statements—such as income statements, balance sheets, and cash flow statements—to assess profitability, liquidity, and financial stability. Analysts also examine qualitative factors like management quality, competitive positioning, and industry trends. Macroeconomic indicators (e.g., interest rates, inflation, GDP growth) are also crucial, as they shape the overall market environment.
In the foreign exchange (forex) market, fundamental analysis centers on economic indicators and monetary policies of different countries. Key components include interest rate decisions by central banks, inflation data, employment figures, and geopolitical developments. These factors affect the relative strength of one currency against another.
Similarly, in the commodities market, analysts consider supply and demand dynamics, weather patterns, inventory levels, and global economic trends. For instance, oil prices are sensitive to geopolitical tensions and OPEC decisions, while agricultural commodities respond to climate conditions and crop reports. Also, since interest rates affect all financial assets, it is recommended to always monitor changes in probabilities of the FOMC rate moves via the Fed Watch Tool.
Across all markets, the goal remains the same: to assess the true value of an asset based on real-world data and long-term fundamentals.
Why Fundamental Analysis Matters - The Importance of Fundamental Analysis for Traders
Fundamental analysis is undoubtedly extremely important in evaluating an asset’s value. It helps investors find undervalued/overvalued financial assets, offering trade opportunities. By focusing on an asset's intrinsic value, traders can predict future price movements and make trade decisions.
For example, crude oil’s price might rise when a war disrupts oil production (as occurred in recent conflicts between Ukraine/Russia, or Israel/Iran). A stock price can fall or rise based on the company’s revenues, earnings reports, and geopolitical developments that might affect its revenues. Changes in the company's management can also affect the stock's price. A nation's currency might move in a certain direction when a central bank’s announcement is released, or when economic indicators signal that inflation is rising or falling.
In volatile markets, fundamental analysis enables investors to assess risks and long-term growth prospects based on the fundamentals rather than short-term market trends. For that matter, many traders also use the VIX index as a barometer to assess the market sentiment, which can also be used as a fundamental indicator. Ultimately, the fundamental analysis provides actionable insights regarding an asset's value, aiding in making informed investment choices.
In a way, fundamental analysis explains the logic behind an asset's price. It tells you why an asset might rise, fall, or stay in equilibrium. In a word, it gives the full picture of why an asset is valued at a certain price level.
Types of Fundamental Analysis
There are two main categories of fundamental analysis. These categories are qualitative and quantitative analysis. These two approaches, while distinct, often complement each other to provide a comprehensive evaluation of an asset’s worth.
Qualitative Analysis
Qualitative analysis in trading looks at non-numerical factors that can affect the price of a financial asset. Unlike traditional trading, which mainly uses charts and data (quantitative analysis), qualitative analysis helps traders understand the reasons behind price movements by focusing on broader and less measurable influences.
This type of analysis considers things like news events, political changes, central bank announcements and speeches, new regulations, a company's leadership reputation, or overall market sentiment. For example, a trader might decide not to buy a stock—even if its numbers look good—because the company is involved in a major lawsuit. In the forex market, unexpected political events or comments from central banks can cause big currency swings, even when economic data remains unchanged. Believe it or not, I've once heard about an automated trading bot that analyses the Fed's official speeches to enter and exit trades. Every time the Fed's official said words that might indicate a rate hike or cut, the bot automatically made a transaction.
Overall, many traders use qualitative analysis along with technical and fundamental tools to make better trading decisions. Although it’s more subjective and harder to measure, it provides important context that can help predict market moves and manage risk more effectively.
Quantitative Analysis
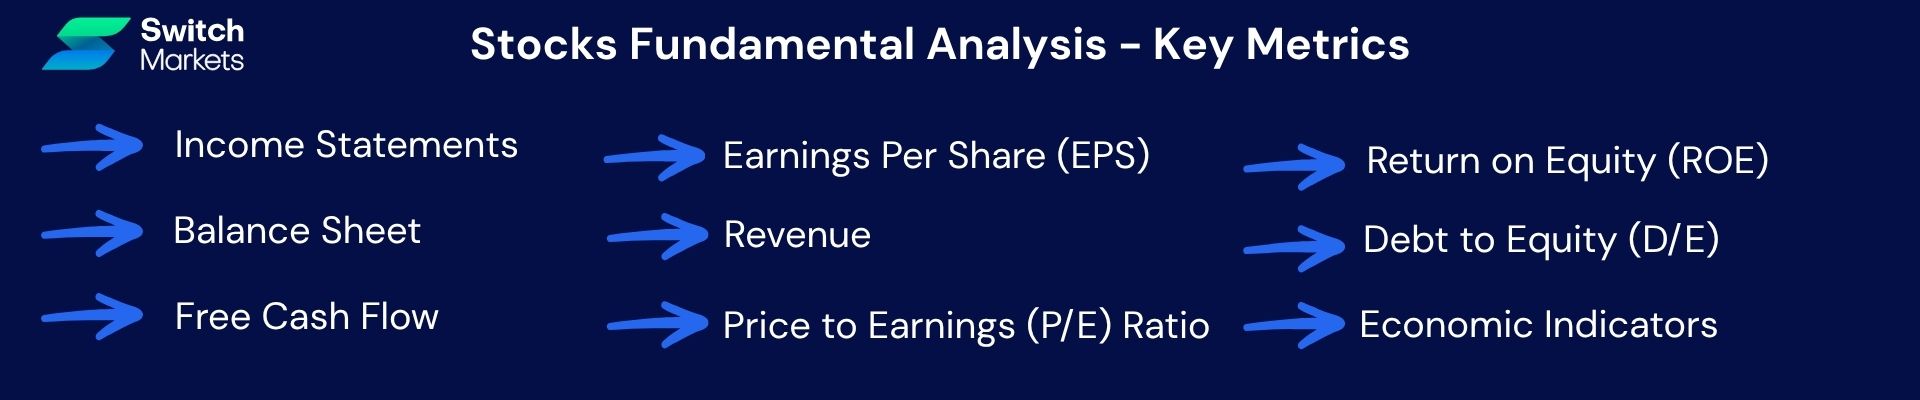
Quantitative analysis uses measurable data from financial statements and reports to gauge an asset’s true valuation. For stocks, key indicators like the P/E ratio, debt levels, and various financial metrics such as revenue growth are crucial metrics used in this type of analysis.
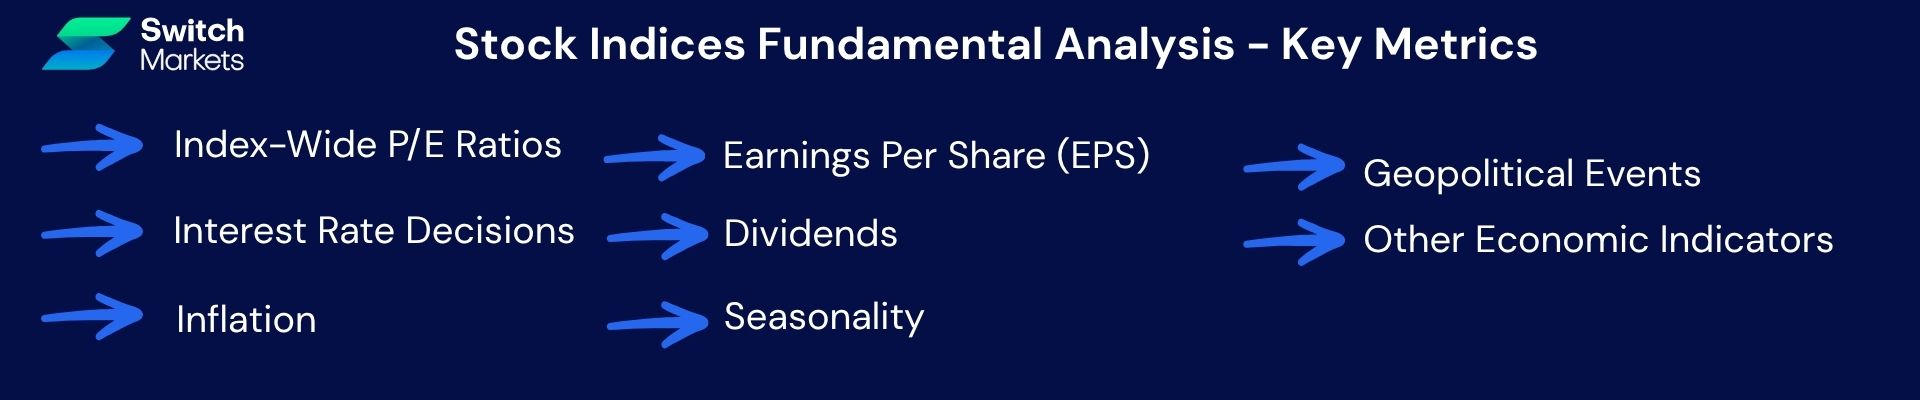
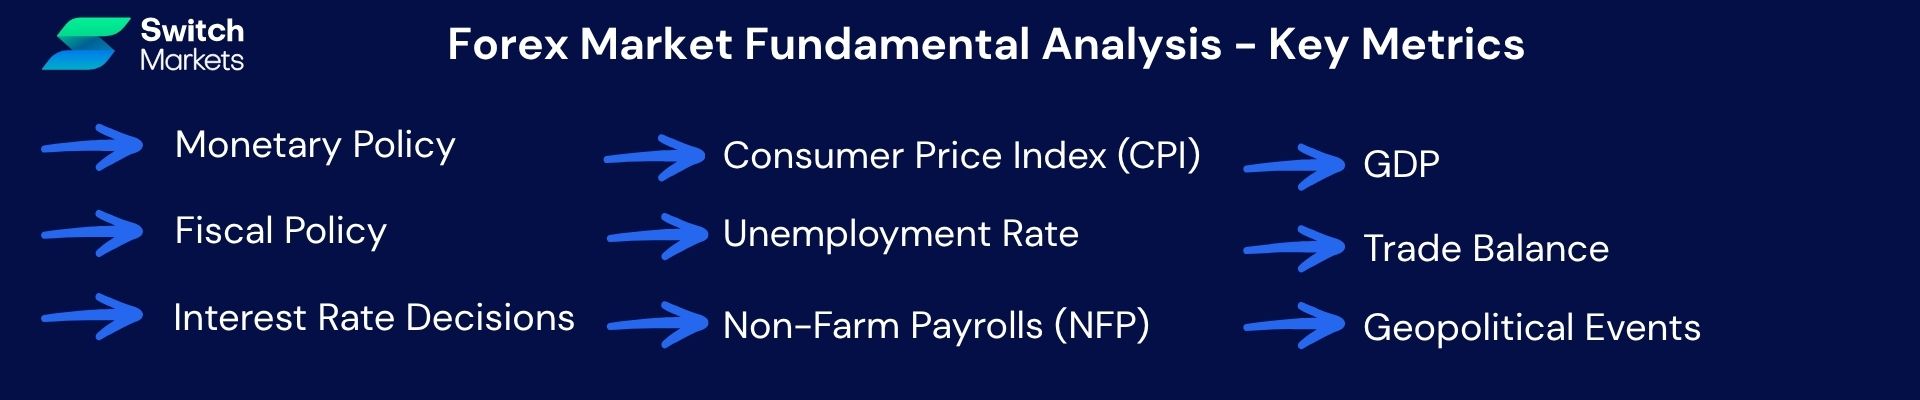
For indices, forex, and commodities (and stocks that are more sensitive to economic changes), economic indicators significantly affect the asset's value. These indicators include, among others:
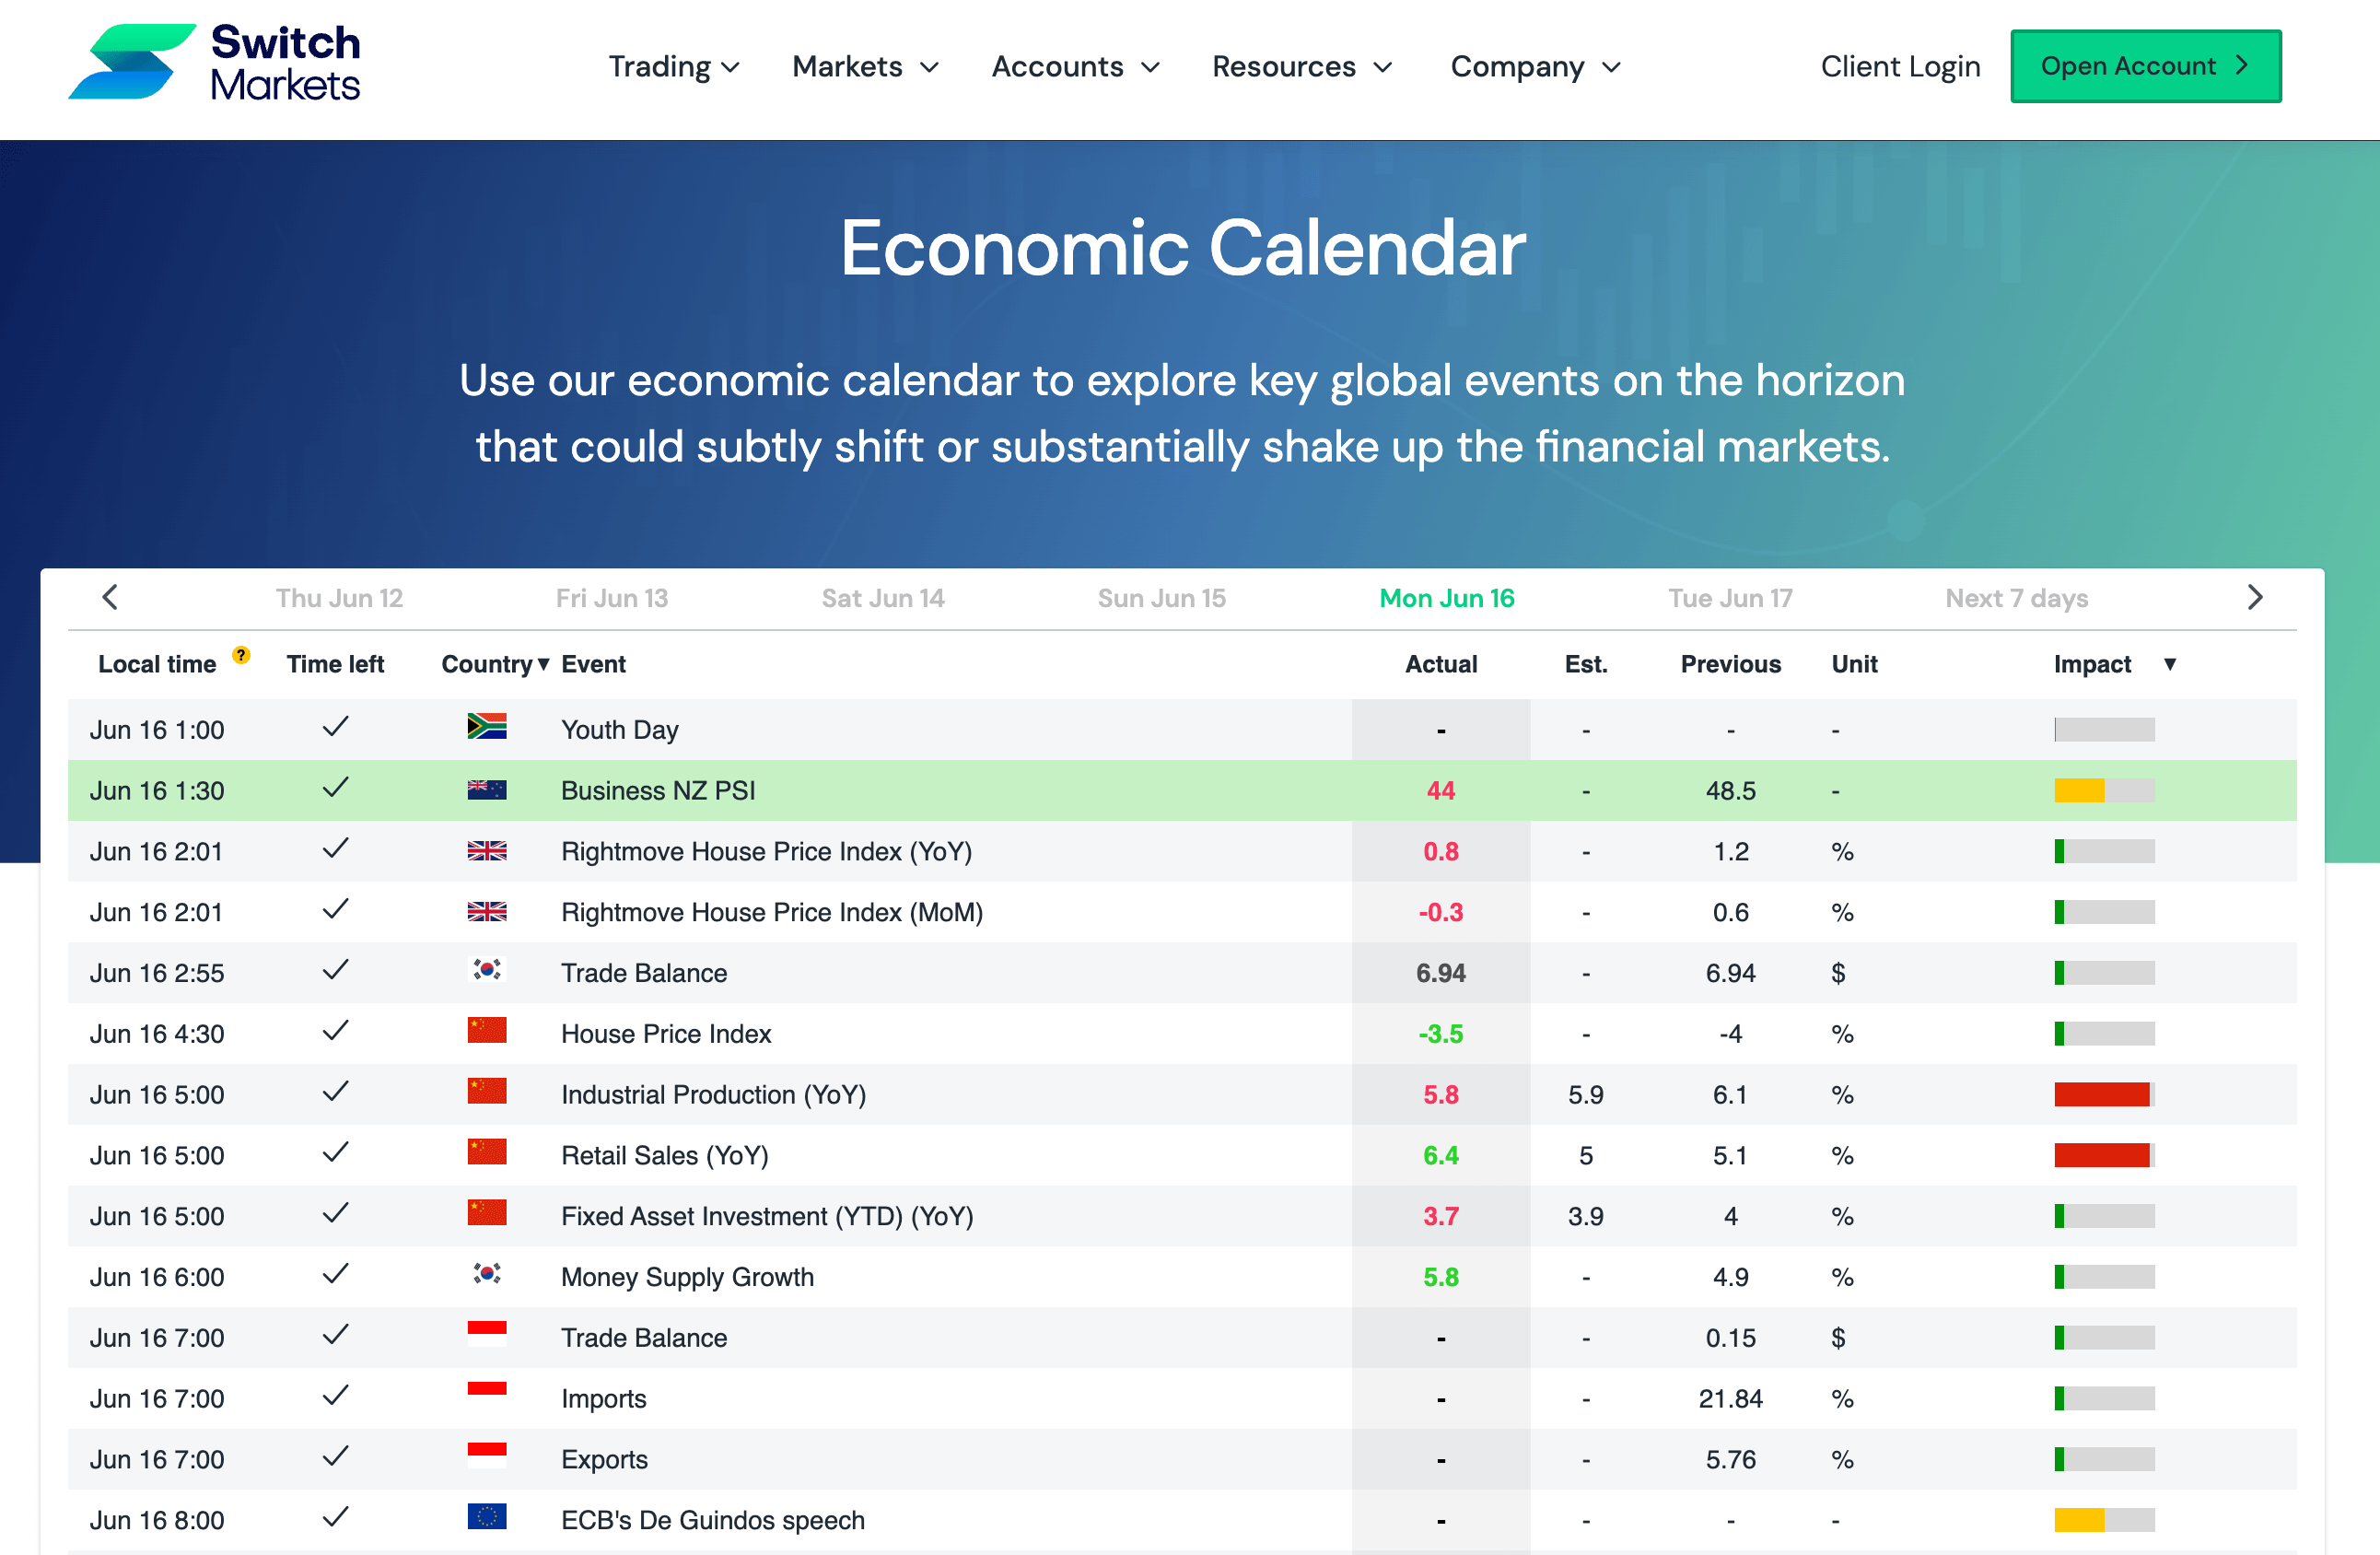
To perform quantitative analysis, traders often use tools like an economic calendar, which allows them to access economic data and trade accordingly. Here's what an economic calendar looks like:
Does Fundamental Analysis Work?
Yes, fundamental analysis can work, especially for long-term trading or investing.
It helps you understand the true value of a stock, currency, or commodity by looking at things like company earnings, economic news, interest rates, or industry trends. If you find something that’s undervalued/overvalued (priced lower/higher than it should be), you might buy/sell it and wait for the market to catch up.
However, it’s not perfect. Prices can take time to reflect the fundamentals, and news or market emotions can cause short-term swings. That’s why many traders use fundamental analysis along with technical analysis (charts and patterns) to get a more complete picture before making decisions.
How to Use Fundamental Analysis Across Different Markets
So, the big question is, how can you use fundamental analysis in trading? What do you need to look at, and how should you interpret different economic signals and indicators?
In general, fundamental analysis can be applied across different markets by tailoring it to the unique factors that influence each asset class. Although the main goal—assessing intrinsic value through economic, financial, and qualitative insights—stays consistent, the specific indicators and focus areas will vary depending on the market.
Let's take a closer look at each asset class:
How to Trade Stocks Using Fundamental Analysis
Trading stocks with fundamentals means diving deep into company health, which may include examining quarterly income statements, balance sheets, and cash flow reports.
Investors track earnings per share (EPS), free cash flow, profit margins, and financial ratios like price-to-earnings (P/E), price-to-book (P/B), PEG, return on equity (ROE), and debt-to-equity. These metrics help gauge profitability, valuation, liquidity, and financial stability.
Seasonal earnings reports and relative comparisons to industry peers and economic trends help determine if a stock is undervalued or overvalued. Analysts may also use models such as DuPont and Piotroski F-score to deconstruct returns and assess operational efficiency. Likewise, monitoring macroeconomic indicators such as GDP growth, inflation, interest rates, and sector-level trends places a company’s financial performance in a broader context.
How to Trade Indices Using Fundamental Analysis
Fundamental analysis of indices involves evaluating the collective strength of the underlying components and broader economic conditions. Instead of individual company data, traders look at aggregate earnings metrics like index-wide P/E ratios, forward EPS projections, and market breadth indicators such as the advance–decline line that reveal whether price movements are broad-based or driven by a few large-cap stocks.
Overlaying this with macroeconomic data such as GDP growth, central bank actions, inflation trends, and consumer sentiment helps assess whether the index is likely to continue its trend or reverse. A strong economy paired with expanding corporate earnings typically suggests further upside, while rising rates or declining labor data could foreshadow weakness.
How to Trade Forex Using Fundamental Analysis
Forex traders base their strategies on economic differentials like monitoring GDP, CPI, PPI, employment reports (e.g., NFP), retail sales, industrial production, and purchasing managers’ indices (PMIs) across countries.
Central bank policies, including rate decisions, forward guidance, and balance sheet measures, directly influence currency valuations, as traders harvest interest-rate differentials and inflation expectations.
Political stability, fiscal policy, and trade balances also drive capital flows and sentiment. So, traders can easily detect potential currency divergences by comparing leading indicators between currency pairs. For instance, a strong employment data in one country versus weak consumer spending in another can be all the confirmation a trader needs to make a trading decision. This method gives a forward-looking edge, allowing participants to position themselves ahead of policy shifts or economic releases.
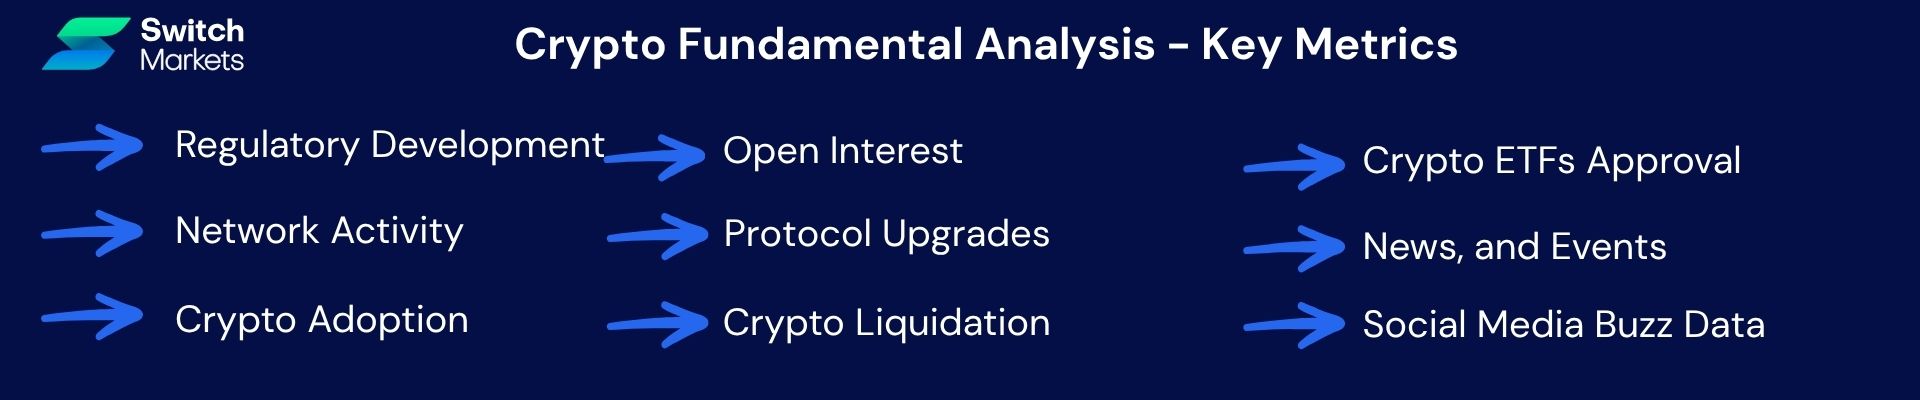
How to Trade Cryptocurrencies Using Fundamental Analysis
Cryptocurrencies lack traditional earnings or financials, so their fundamentals are found in network activity, regulatory news, and adoption trends. Traders follow on-chain metrics like active addresses, transaction volumes, hash rate, open interest, and liquidation heat maps to assess usage, leverage, and risk.
Similarly, cryptocurrency traders also keep their eyes on institutional adoption such as approval of ETFs, custody infrastructure, and large wallet movements in order to gain insight into investor participation.
At the same time, regulatory developments and macro factors (like countries embracing crypto or potential bans) influence sentiment and outlook. Finally, protocol upgrades (e.g., Bitcoin halving, Ethereum hard forks) signal technical shifts that can change supply economics and value perception.
Fundamental Analysis vs. Technical Analysis
One of the questions that intrigues many beginner traders is which method works better: fundamental or technical analysis.
Well, there’s no decisive answer to this question. While fundamental analysis focuses on the core qualities of an asset, seeking intrinsic value that the market can often miss, technical analysis studies price movements and trading volumes to identify patterns, focusing primarily on price trends and market data.
Ultimately, both aim to help traders make smart choices, but they differ in approach. Let’s understand the difference between the two and how to combine both methods.
What’s the Difference Between Fundamental and Technical Analysis?
There are key differences between fundamental and technical analysis.
First, ideology. There’s a big difference between the two approaches in the way a trader might analyze an asset. In other words, each method has a different belief or ideology in the view of how the markets work. A technical analysis trader often looks at charts and price action to determine when to enter or exit a position. In that sense, many technical analysis traders claim that everything is visible on a price chart, including all the economic data and the intrinsic value of an asset. The idea of technical analysis is that history repeats itself, and this allows traders to find opportunities.
Another key difference lies in the type of information they use and the beliefs behind it. Fundamental analysis looks at the asset’s financial health and performance to figure out its real or "intrinsic" value. Technical analysis, on the other hand, studies price movements and trading volume to predict future market behavior. As such, technical analysts put more emphasis on charting platforms, technical indicators like Fibonacci trading strategies, chart patterns, and historical data. On the other hand, those who rely on fundamental analysis use a different set of trading tools that include an economic calendar, financial statements, earnings and revenue reports, news, and market updates.
At last, another key difference between the two lies in the type of trading - medium to long-term versus short-term trading. It is often said that technical analysis is more suited for short-term traders while fundamental analysis is typically used for long-term investment decisions. This is generally true, although the vast majority of traders often use a combination of the two techniques to make trading decisions. Day traders look at economic data releases and factor in news events to understand the market sentiment and identify trade opportunities. Meanwhile, swing and position traders who primarily rely on fundamental analysis also take into consideration key price levels and technical analysis signals to confirm their trade decisions.
How to Combine Technical and Fundamental Analysis for Better Results
Combining fundamental and technical analysis allows traders to identify trade opportunities and optimize entry and exit points for trades. This approach provides a complete view of price action and improves timing and risk management trading techniques.
For example, it is extremely common to see all technical indicators suggest a buy on a certain instrument, and then, when some major news is being released, the asset goes in the other direction.
So, in order to combine fundamental and technical analysis, you’ll have to integrate both methods into your trading routine. That means you’ll have to scan market news, view the economic calendar, and stay alert to any key data that is expected to be released, including economic data, earnings reports, and geopolitical news. At the same time, you must monitor trading charts and use all the tools available to identify key levels and entry and exit levels.
Tools for Effective Fundamental Analysis
There’s a variety of tools available for effective fundamental analysis, with each suited for different markets and asset classes. These tools include:
Here's a great source of news, for example, to conduct fundamental analysis across all markets. This gives you the ability to cover market news and get a sense of what's moving the markets.
Limitations of Fundamental Analysis
Although fundamental analysis is powerful, it has limitations. Let’s quickly review each of these limitations and how you should address them.
Time-Consuming Process
A key characteristic of fundamental analysis is that it is a time-consuming process. Retail traders may find this challenging due to a lack of resources or knowledge to manage the extensive time and effort required. To analyze data of a company, a commodity, or a currency pair, traders must spend time reading the reports, and validate the accuracy of the published data.
Dependence on Historical Data
Fundamental analysis often relies on historical data, which may not accurately predict future performance due to changing market conditions. Reliance on past performance can be a significant limitation, especially in volatile markets. It should also be noted that quite often, key news is already priced in by the markets, and traders must trade accordingly.
This economic analysis can be a double-edged sword, as past financial information may not always predict future success. Economic shifts, political factors, or new technologies can quickly render past financials less relevant and unreliable for future predictions.
Subjectivity in Interpretation
Subjective interpretations characterize fundamental analysis. Analysts may view economic results differently and determine varying valuations based on their assumptions and perspectives. When a news release or economic data is coming out, traders might interpret it differently, which may cause confusion in the markets. It is also extremely important to take into account revisions of previous months. Often, when economic data is released, a revision of the previous data is also released. This can create two different figures that might clash. For instance, the Non-Farm Payrolls data for the last month can be higher-than-expected, but the revision of the prior month can indicate that the job market is shrinking. When this happens, traders often try to estimate which has the higher impact on the markets.
Therefore, combining both analyses can mitigate subjective biases and enhance overall effectiveness.
Being the Second to Respond
Another limitation of fundamental analysis is that retail traders are second (or even higher) on the list of those who respond. For example, when news is released, major banks and financial institutions are the first to react. This means that retail traders are not the first to get the news/data, and as such, they can miss the first move following a key data release.
Final Word
In sum, fundamental analysis is a powerful methodology for assessing the true worth of financial assets by examining financial data and broader economic indicators. By focusing on key components such as financial statements, economic indicators, key reports, news, geopolitical developments, and industry trends, investors can make informed decisions and identify entry levels.
Due to its limitations, we suggest that you find the right way to use fundamental analysis. The most effective method is to learn how each economic data and a piece of news might impact the markets, or your chosen asset. Further, it is advisable to combine technical and fundamental analysis for better results. This is the ideal method to analyze the markets and get an overview of the market sentiment and price action. You should, therefore, equip yourself with the right fundamental analysis tools and knowledge, and you’ll be well on your way to making more informed trading decisions.
Frequently Asked Questions
Here are some of the most common questions about fundamental analysis:
What is the primary goal of fundamental analysis?
The primary goal of fundamental analysis is to assess an asset's true value by analyzing its financial health and economic conditions. This enables investors to make informed stock decisions, and ultimately, this approach aids in strategic investment choices.
Can fundamental analysis predict future price movements?
Theoretically, yes, fundamental analysis can be used as a tool to predict future price movements. News and economic data can offer valuable insights that can help traders identify trade opportunities. However, it should be noted that fundamental analysis cannot reliably predict future price movements due to the ever-changing market conditions.
How to learn fundamental analysis?
To learn fundamental analysis, you need to study financial statements, economic indicators, and valuation methods and their impact on each asset’s price movement. This can be done by reading guides, watching videos, taking online courses, and reading popular fundamental analysis books.
Risk Disclosure: The information provided in this article is not intended to give financial advice, recommend investments, guarantee profits, or shield you from losses. Our content is only for informational purposes and to help you understand the risks and complexity of these markets by providing objective analysis. Before trading, carefully consider your experience, financial goals, and risk tolerance. Trading involves significant potential for financial loss and isn't suitable for everyone.